Be yourself; Everyone else is already taken.
— Oscar Wilde.
This is the first post on my new blog. I’m just getting this new blog going, so stay tuned for more. Subscribe below to get notified when I post new updates.
Be yourself; Everyone else is already taken.
— Oscar Wilde.
This is the first post on my new blog. I’m just getting this new blog going, so stay tuned for more. Subscribe below to get notified when I post new updates.
Step 7
Going into step 7, I was quite nervous, as I knew it would be difficult to choose some products that Spectris sell as it is so broad and they do offer multiple services around the world. Their products fall under different business segments including Materials Analysis, Test and Measurement, In-line instrumentation and industrial controls. They do also have several operating companies including Brüel & Kjær Vibro, BTG, NDC Technologies, ESG Solutions, HBM, Millbrook, VI-grade, Omega Engineering, Malverm Panalytical, Particle Measuring systems, Concept Life Scienes, Red Lion controls and Servomex which they manufacture, produce and sell products to consumers. These companies fall under the different business segments. As the there is so many products that Spectris can supply within different segments, I conducted further research and decided to base the products of case studies from products that Spectris has previously supplied from their operating businesses as it was easier to determine the products Spectris would sell. I was not so confident with trying to determine the cost of each of the products as I had never associated with them and I also could not locate any pricing information on the Spectris home page or form any reports so I know I will really have to guess the pricing of the products. I was also nervous about determining the variable costs and contribution costs. After I estimate the selling price and variable costs, I will be able to determine the Contribution Margin. I also found it helpful to refer to the Spectris Corporate spreadsheet – https://www.spectris.com/~/media/Files/S/Spectris/documents/signpost-docs/spectris-factsheet-march-2019.pdf.
First product from Spectris:
The first product falls under the Test and Measurement segment that Brüel & Kjær Vibro completed. Link to case study – https://www.spectris.com/about-us/case-studies
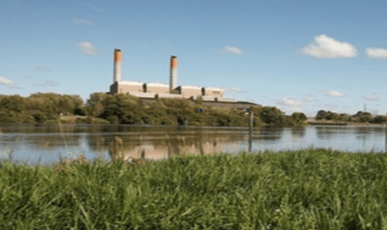
I really had no idea how much a VC-8000 STEPOINT system would cost. I had never heard of this system before and didn’t really know what it would entail. Based on reading the case study, I can see understand that the system provides both protection and condition monitoring of the generating units for the 250 gas-goal fired steam turbine. This system is using for continuous machine monitoring to fit specific needs. I have decided to base my figures off the Spectris Corporate spreadsheet. The sales within the Test and Measurement were a total of £522.6m. I’m going to estimate that to purchase the VC-8000 STEPOINT system it will be roughly $20 000 as I can imagine. I am going to estimate the variable costings to be 30% of the sale price, totalling $6000. I did again refer to the Spectris Corporate spreadsheet for this. This variable costing would include labour costs and equipment needed to construct the system.
Contribution Margin = Sales – Variable Costs
Sales 20 000 – Variable 6000
Contribution amount = 14 000
Second product from Spectris:
The second product I received from this case study – https://www.spectris.com/about-us/case-studies which falls under the segment of Industrial Controls.
Spectris’s operating business Omega Engineering created a temperature monitoring system that also includes data automation that makes food safety compliance more effective. They constructed this system for the Food Innovation Centre at Rutgers University (FIC). FIC is a unique food business incubator and accelerator. They work to ensure food safety training amongst organisations and have a compliance and inspection process, thus needing gold standard of food safety constantly. Omega Engineering took that opportunity to enhance FIC monitoring solution and created a system that did more than just ‘monitor food temperature’. This system was designed to develop an automated wireless temperature monitoring and data analytics solution for FIC, which also includes receiving alerts when areas are falling under the correct temperature.
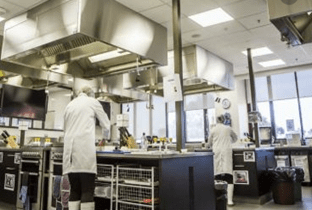
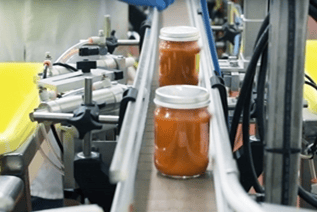
Again, I was not sure what this system would cost. General small food temperature monitoring equipment for a domestic household could range anywhere from $20 – $200 so I am definitely going to estimate this system, being so large and would take a lot of time, energy and resources, would be roughly $40 000 to implement. I am going to estimate the variable costs will be roughly 35% as it would take a lot of labour time to construct the system and all equipment involved. Variable cost would work out to be $14 000.
Contribution Margin = Sales – Variable Costs
Sales 40 000 – Variable 14 000
Contribution amount = 26 000
Third product from Spectris:
The third product is from case study https://www.spectris.com/about-us/case-studies which also falls under the Industrial Controls segment.
One of Spectris operating companies Red Lion Controls assisted to improve communication across four pump stations along an 11-mile pipeline, including four pump station RTU cabinets that sit along the pipeline, to deliver water to a treatment facility for Quantum. Quantum needed to leverage and improve the existing infrastructure while infusing modern technology. Red Lion Controls implemented a product that measures, monitors, controls and informs the product during the production process.
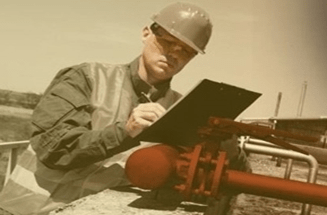
As the 11-mile pipeline is quite large, I can imagine it would have been costly for Quantum to implement Red Lion Controls new communication network. I am going to estimate the selling cost of this system would be around $1500 each as it is a 4G LTE cellular RTU and GPS control system. After further research, Red Lion’s RAM 600 celluar RTU’s feature up to five Ethernet ports and a RS-232 serial port. It also features a web-based engine that can trigger built in or send SMS text messages based on real-time operational data and can process in extreme conditions. I am going to estimate the variable costing would be roughly $400 including labour time for someone to construct this system and equipment.
Contribution Margin = Sales – Variable Costs
Sales 1500 – Variable 400
Contribution amount = 1100
What is the Contribution Margin telling us?
The contribution margin from the VC-8000 STEPOINT system, temperature monitoring system and RAM 600 cellular RTU was $14 000, $26 000 and $1100. The contribution margin traditionally tells us how much of the revenue will be available after the variable expenses are covered, for fixed expenses and then if any is left, it would (hopefully) go into the profit.
The variable costs would include labour, equipment for the systems and products being processed. However, the fixed costs for Spectris and their operating businesses (Brüel & Kjær Vibro, BTG, NDC Technologies, ESG Solutions, HBM, Millbrook, VI-grade, Omega Engineering, Malverm Panalytical, Particle Measuring systems, Concept Life Sciences, Red Lion controls and Servomex) could include electricity, rates, wages for staff etc.
As all Spectris contribution margins are above zero, they will all contribute to the profit of the organisations.
Constraints on Spectris
After reviewing reports and annual statistics, Spectris definitely seems like they are a competitive business and have quite a large volume of customers within each different segment. However, Spectris would also face some constraints. It is not uncommon that firms would face constraints. Constraints can alter or affect their decisions for the firm including products or services they offer.
As Spectris deliver its services from different operating businesses, (Brüel & Kjær Vibro, BTG, NDC Technologies, ESG Solutions, HBM, Millbrook, VI-grade, Omega Engineering, Malverm Panalytical, Particle Measuring systems, Concept Life Sciences, Red Lion controls and Servomex) and again in different segments, this offers the great possibility they will be faced with several constraints from each segment or operating business. These constraints could include competition from other suppliers, staffing issues and things such as supply shortages. Supply shortages could hold back overall sales growth. There is also the risk of potential product refreshers from Operating Businesses as they would go through different stages of products, and some may need updating. Spectris would have to take into consideration these possible constraints when making decisions. To combat these constraints, Spectris does a strategic review to assess each of the operating companies to determine their value creation potential and determine key attributes that are required to be a platform business.
Step 8
Please find Ratios spreadsheet attached with submission.
I was quite anxious going into step 8 as I was hoping I could complete the linking correctly and understand what the ratios were telling me. I am excited to learn more about my company through the financials.
Trying to calculate the share price was difficult to locate on my financial statements as there was a lot of figures. I ended up needing to control F and find the closing share price as putting “Share price” came up with a lot of results. I had to search this closing share price within each financial statement as they did not show in each other’s that I could locate. My understanding of the ‘Share Price’ is the dollar amount that investors want and are willing to pay for one share of the company’s stock and products. I was very interested in this ratio as I feel like so far Spectris do really well with their figures. Once I calculated the share price, I was happy to see the trend had become positive. In 2015, the amount that investors were wanting to invest which by 2018, it turned to 6 million – finish this
With the ordinary share price, I found this easy to locate on the financial spreadsheet. Once I calculated the share price, I was happy to see the trend had became positive. In 2015, the amount was 0.6 million which by 2018, it turned to 6 million.
Profitability Ratios
Profit margin = Profit after income tax (NPAT)/ sales. Within the profit margin ratio, my understanding is that it compares sales and demonstrates how well the company is actually doing and how much is returning into net profit. So, we would want to see it as a higher ratio, as the higher it is, the more profit is going into the company. What return are we gaining? After looking at Spectris Net Profit Margin ratio, I am very happy with the figures. From 2015, the net profit was 8.9% and began to get higher over the years. In 2018, the ratio was 13.7% which is a great improvement from 2015.
It is my understanding that Return on Assets (ROA) is an indicator of how efficient the company is at using its assets to actually generate the earnings. I can imagine that the higher the ratio, the better as this would mean the company was successfully handling the assets. Comparing Spectris ROA ratio, there is improvements from 2015 – 2018 by quite a lot. In 2015, the ratio was 7.3% which climbed to 10% in 2018. This means that in 2018, Spectris received 10% of the total assets back and earned $0.10 for every $1 it has in assets.
Efficiency Ratios
My understanding of the days of inventory is it is how long it is taking the company to sell the products. I found this section challenging and it was hard to determine what to select as the ‘daily cost of goods sold’. Looking at Spectris days of inventory, it was interesting that in 2015, the days totalled 131.41 and as the years went on, it improved drastically in 2017 with 97.61 to then spike again in2018 with 133.36 days. In my opinion, this is not a positive result as it is showing that from the time the product is produced, it stays in inventory for that period of time. However, if we assume Spectris maintains a constant quantity in its inventory, which is seems to by looking at the figures, there may be economic or competitive factors that are causing the high inventory days. I did a quick research and there are several high competitors with Spectris including Bruker, which has had funding go into the company with a total revenue of $3.9 billion, or Shimadzu with a revenue of $3.5 billion. This would definitely impact the sales that Spectris is producing, although still being quite competitive.
My understanding of total asset turnover ratio is it helps us to identify how efficient the company are using their assets and the sales created from the assets. Looking at Spectris total asset turnover ratio, it has not done very well as it is all averaging about 1-cent. I believe a good turnover ratio should be around 4 -6 from research and speaking with other students, as this usually means the rate which companies restock items is balanced.
Liquidity Ratios
Looking at the current ratio, it is my understanding that you are analysing and comparing the company’s current assets to its current liabilities and how well they pay for the current liabilities or short term obligations. For Spectris, the % has shifted from 2015 to 2018. In 2015, the current ratio is 2.96 and in 2018 it is 2.43. The current ratio for Spectris is telling us that they were able to pay their debts and short-term obligations. The higher the ratio, the more capable a company is to paying its obligations so although it did go down from 2015, I was quite happy to see Spectris Liquidity ratio was more than 1. These records indicate that Spectris is in good financial health. Although, because it didn’t really change from 2017 to 2018, this may mean that there was a weakness in the current ratio which includes the difficulty of comparing and measuring all the operating businesses or lack of trending information.
Financial Structure Ratios
My understanding of the Equity ratio is it is funded by shareholders and determines the portion of assets that are funded by debt or equity. Looking at Spectris 2018 figure, it was 58.9%, so for every dollar of assets that was funded by the equity investors, only roughly 58.9c was invested.
In relation to the Debt/ equity ratio, it is my understanding that this will show that for every dollar the equity investor is investing, how much is the bank or another contribution company actually is putting in to fund the business. In 2018, this was 69.8% which I believe is quite high, as this may show investors how much debt Spectris is in. It has increased from 2015. With only 51.0% and even 2017, which was only 49.4%.
Market Ratios
When I calculated the dividends per share it was quite large which made me question if I did it correctly. Listening to Maria’s video on Ratios, the dividends are meant to be low, as this is the amount paid out in dividends to shareholders and investors. Although as per the study guide chapter 4, dividends can be affected by a firm’s dividend policy, which then ultimately affects what is being transferred. After referring to the financial statement for 2018, Spectris proposed to pay a dividend of 40.5 pence ($0.78 Australian money), combined with the interim dividend of 20.5 pence ($0.39 Australian money), gives a total dividend of 61.0 pence ($1.17) per share. I am still not sure how the total dividends I have calculated within the ratios came to such a high number. It may be impacted from future investment needs.
The basic earnings per share is the difference between diluted (what if), earnings per share is what is based on profit. Comparing Spectris figures, I am pleased with the higher earnings however, was significantly reduced from 2015, $176.33 to 2018, $35.02. This is telling us Spectris’ profitability from its profit and shares. It is my understanding this is calculated to determine, for every share, how much have we earned. It is the total profit, spread across total number of shares and what they could have paid out to the company. This would need to be a larger figure as companies would rather retain earnings than provide to shares
My understanding of Price Earnings Ratio is the measurement of inflation of a shares and how long it will take to pay back with investment. I was a bit concerned when I saw Spectris figures at 0.07 for 2018 and even less in 2016 and 2015 at 0.01. My understanding is economic conditions can influence the Price Earnings ratio as they affect the financial market. Another reason why this figure may be so low, is the company may have increased its debt. This is a bit confusing as with the liquidity ratio, we can see Spectris is very successful with paying off the debt.
Ratios based on reformulated Financial Statements
The difference with this section of ratios is we have separated the operating and financial assets. I was really happy with the return on equity ratio as the trend is going in a positive direction from 2015 at 10.95% to 2018 of 17.04%. This tells me that Spectris are able to generate profits from its shareholders and investors of the company.
In relation to the Return on Net operating Assets I compared to RNOA under return on assets within Probability and trend is similar but when we separate the financing items, the return gets better and gives better identification on how Spectris is using their operational assets.
For the net borrowing costs, I can understand that we would be comparing this like an interest rate on loan. Spectris figures and percentages tell me good source of financing in the last two years as it is decreasing the cost of the loans from 2017 to 2018.
When I calculated the profit margin figure and compared it to the margin above I can understand that for every dollar of sales we are turning 13.1c (as per 2018) into operating income. I can see the trend is starting to increase and there not much difference with the profit margin in profitability ratios, in fact they are almost identical. The net profit margin is also telling me that most of the income is to do with operating activities.
My understanding of the total asset turnover is calculating how many times are we are turning over the dollar value of our assets into sales. I can imagine we would want to see a bigger figure and see that it is increasing. In relation to the Asset turnover, when I calculated the figure I compared to Total Asset Turnover in the Efficiency ratio. I noticed that the trends are similar but both slightly decreasing. This may mean that Spectris may not be utilising their assets to actually generate the sales. The turnover has improved when separating the finances out from the rations based on reformulated Financial Statements.
Economic profit
My understanding of Economic Profit is it calculates the total revenue received and also implies the costs for a firm. It is to measure the earnings of the firm. To work out the Economic profit, we can look at the main drivers which is Return on net operating assets (RNOA). RNOA is the Operating income after tax (OI) divided by the Net operating assets (NOA). For the weighted average cost of capital (WACC) I decided to use 11% as when I was searching the financial statements for Spectris from 2015 to 2018 it remained 11%. I was reluctant to use this percentage for WACC as the recommended figure from the assessment instructions was 10%. However, I decided to stick with what was on the financial statements as this also wouldn’t change much from 10% to 11% I imagine.
In 2018, the economic profit was $46.77, in 2017 it was $52.83, in 2016 it was $20.76 and in 2015 it was -$16.69. I was happy that most of the totals were positives. Spectris is trying to produce their goods to maximise the profit and the totals pf economic profit meant that the profit is a greater return than the WAAC. In 2015, as the profit did not go over the WACC which resulted in a negative economic profit. I was surprised considering how well Spectris did with its closing balance’s within the Statements of Movement in Equity, and the total of assets and liabilities. It had quite a large number of total operating assets and liabilities in 2015 through to 2018 including the NOA of $1584.20 in 2018. A firm’s normal profit is revenue, including explicit and hidden expenses, whereas the economic profit is the difference between the revenue received from the sale of an output and the cost of all the inputs used. From reading the study guide, it is my understanding that the economic profit is the ‘what if’ analysis for production levels. I believe the economic profit may have may resulted in a negative in 2015 from the hidden costs such as equipment, labour or production costs from the different operating business that weren’t taken into account. They may not have been taken into consideration in relation to the financial statement and accountants may not have included it.
Step 9
I actually really enjoyed completing this section of the assessment. I found it really interesting to put these figures in excel and work out the payback period for the two options.
Spectris is wanting to identify a group of potential operating businesses to expand the work capital and deliver greater value to a wider group of clients. To do this, they are considering investing in two operating businesses. The first option is Instrument Solutions and the second option of investment is Ergon Energy. Currently Spectris has several operating businesses that operate and supply award-winning productivity-enhancing instrumentation and control systems and products to a wide variety of customers globally. There is now an opportunity for Sprectris to expand its operating businesses and invest to gain further economic growth.
As there are several other businesses and investors that Instrument Solutions and Ergon Energy may have, it is suggested that each of these products be given the length of 10 years. Managers need to decide and make decisions that will affect the business long-term and it is a goal for making long-term capital investments These two choices of investment are expected to provide benefit in many years in the future. Spectris’s aim is sales growth and to become a more focussed and simplified business, which is highlighted several times in their financial statements. The cash flows generated by both of these businesses would ensure profit is going back into equipment and resources for the systems, technically demanding industrial applications and products that Spectris and its operating businesses use each year. It will also contribute to staff wages and marketing of Spectris. While choosing the right investment we have to consider, would this investment create us value for long-term decisions? As once you commit to these long-term investments, it is not easy to reverse or go back on the investment decision. There is the benefit of both options being an Independent project meaning the cash flow of one investment are unaffected by the acceptance of the other investment.
The investment will begin on January 1, 2021 and the estimated future cash flows are expected to be received on 31 December of each year. The estimated cost, the estimated years, residual value and estimate future cash flows of each investment opportunity are set out in the table below. All amounts are express in Australian Dollars AUD. We are going to assume the rate of return/ discount rate/ WACC of 11% as this is the same as I used with my ratio, which was the WACC I found for Spectris within the financial statement. We are going to estimate that Instrumentation control sell products for 2m and Ergon Energy sell products for 3m.
| Instrument Solutions | Ergon Energy | |
| Original Cost | $55 million | $70 million |
| Estimated years | 10 years | 10 years |
| Residual vision | $2 million | $3 million |
| Estimated future cash flows: | ||
| Year 1 – 31 December 2021 | -3 million | – 5 million |
| Year 2 – 31 December 2022 | $10 million | $12 million |
| Year 3 – 31 December 2023 | $15 million | $22 million |
| Year 4 – 31 December 2024 | $20 million | $11 million |
| Year 5 – 31 December 2025 | $25 million | $25 million |
| Year 6 – 31 December 2026 | $11 million | $17 million |
| Year 7 – 31 December 2027 | $16 million | $10 million |
| Year 8 – 31 December 2028 | $21 million | $18 million |
| Year 9 – 31 December 2029 | $7 million | $8 million |
| Year 10 – 31 December 2030 | $13 million | $14 million |
Please find below the Net Present value (NPV), internal rate of return (IRR), and the payback period for each option of investment. Again, the discount rate is 11% and the NPV has been calculated using this rate. The below figures are all displayed in Australian Currency (AUD).
| Instrument Solutions | Ergon Energy | |
| Net Present Value (NPV) | $20.11 | $3.18 |
| Internal Rate of Return (IRR) | 17.6% | 12% |
| Payback period | 4.52 years | 5.29 years |
The Net Present Value (NPV is essentially the difference between the present value of cash flows over a period of time. I have used this formula to analyse the profitability of my two investment options. While calculating the NPV of the each of my options of investment for Sprectris, I was really looking for a positive NPV as this will indicate that the investment would add value to the firm. Having a positive NPV would highlight that the firm will get more back than the cost of the capital. Both Instrumentation Solutions and Ergon energy both has positive NPV, although Instrument Solutions NPV is greater, this gives a more competitive edge.
With the Internal Rate of Return (IRR), we are measuring the investment rate of return. We are using this context savings and loans on the investment and we need it higher than the discounted rate of 11%. Again, the higher the rate the better as we need to ensure the return of the investment will outweigh the actual cost of the investment. If the IRR is negative, there would be no reason to consider the investment option as it would not give a good return. The IRR rate for Instrument Solution is 17.6% where as Ergon Energy was 12%. Although both of these investment options are is higher than discount rate, Instrument Solutions have exceeded the IRR a lot more than Ergon energy, which again, gives Instrumentation Solutions a leading edge.
The payback period refers to how many years it would take for the initial cost of the project/ investment to be earned back to Spectris from the cash flows that were estimated. We need to ensure that the payback period doesn’t exceed the initial estimated years for the investment. If it does, there would be no reason to take the investment. For option 1, Instrument Solutions occurs in approx 4.52 years. The payback period for Ergon Energy is 5.29 years. Again, if Spectris chose option 1, Instrument Solutions, they will receive the initial cost of the investment back earlier.
The main weaknesses I can see with these investment options is that the cash flows are estimations which would clearly really impact all the figures associated with the investments as it is not a true representation of the figures. I can imagine it would be difficult to really understand and know each cash flow. There are also several weaknesses with the NPV, IRR and the Pay back period. The payback period ignores the time value or money and it does not adjust or account for differences in the over all investment, which may impact the time in which the company received the initial cost of investment. This method also does not take into consideration the cash flows after pay back, therefor the company may not have a true representation to determine if the investment will be worth it or not. The weakness associated with NPV is it is very reliant and sensitive to the discount rate, which therefor would be easy to manipulate and change. Any changes in the discount rate would mean big changes to the NPV. In relation to the IRR, the weakness of this method would include potential unrealistic assumptions about the reinvestment of funds.
Going into step 7, I was quite nervous, as I knew it would be difficult to choose some products that Spectris sell as it is so broad and they do offer multiple services around the world. Their products fall under different business segments including Materials Analysis, Test and Measurement, In-line instrumentation and industrial controls. They do also have several operating companies including Brüel & Kjær Vibro, BTG, NDC Technologies, ESG Solutions, HBM, Millbrook, VI-grade, Omega Engineering, Malverm Panalytical, Particle Measuring systems, Concept Life Scienes, Red Lion controls and Servomex which they manufacture, produce and sell products to consumers. These companies fall under the different business segments. As the there is so many products that Spectris can supply within different segments, I conducted further research and decided to base the products of case studies from products that Spectris has previously supplied from their operating businesses as it was easier to determine the products Spectris would sell. I was not so confident with trying to determine the cost of each of the products as I had never associated with them and I also could not locate any pricing information on the Spectris home page or form any reports so I know I will really have to guess the pricing of the products. I was also nervous about determining the variable costs and contribution costs. After I estimate the selling price and variable costs, I will be able to determine the Contribution Margin. I also found it helpful to refer to the Spectris Corporate spreadsheet – https://www.spectris.com/~/media/Files/S/Spectris/documents/signpost-docs/spectris-factsheet-march-2019.pdf.
First product from Spectris:
The first product falls under the Test and Measurement segment that Brüel & Kjær Vibro completed. Link to case study – https://www.spectris.com/about-us/case-studies
I really had no idea how much a VC-8000 STEPOINT system would cost. I had never heard of this system before and didn’t really know what it would entail. Based on reading the case study, I can see understand that the system provides both protection and condition monitoring of the generating units for the 250 gas-goal fired steam turbine. This system is using for continuous machine monitoring to fit specific needs. I have decided to base my figures off the Spectris Corporate spreadsheet. The sales within the Test and Measurement were a total of £522.6m. I’m going to estimate that to purchase the VC-8000 STEPOINT system it will be roughly $20 000 as I can imagine. I am going to estimate the variable costings to be 30% of the sale price, totalling $6000. I did again refer to the Spectris Corporate spreadsheet for this. This variable costing would include labour costs and equipment needed to construct the system.
Contribution Margin = Sales – Variable Costs
Sales 20 000 – Variable 6000
Contribution amount = 14 000
Second product from Spectris:
The second product I received from this case study – https://www.spectris.com/about-us/case-studies which falls under the segment of Industrial Controls.
Spectris’s operating business Omega Engineering created a temperature monitoring system that also includes data automation that makes food safety compliance more effective. They constructed this system for the Food Innovation Centre at Rutgers University (FIC). FIC is a unique food business incubator and accelerator. They work to ensure food safety training amongst organisations and have a compliance and inspection process, thus needing gold standard of food safety constantly. Omega Engineering took that opportunity to enhance FIC monitoring solution and created a system that did more than just ‘monitor food temperature’. This system was designed to develop an automated wireless temperature monitoring and data analytics solution for FIC, which also includes receiving alerts when areas are falling under the correct temperature.
Again, I was not sure what this system would cost. General small food temperature monitoring equipment for a domestic household could range anywhere from $20 – $200 so I am definitely going to estimate this system, being so large and would take a lot of time, energy and resources, would be roughly $40 000 to implement. I am going to estimate the variable costs will be roughly 35% as it would take a lot of labour time to construct the system and all equipment involved. Variable cost would work out to be $14 000.
Contribution Margin = Sales – Variable Costs
Sales 40 000 – Variable 14 000
Contribution amount = 26 000
Third product from Spectris:
The third product is from case study https://www.spectris.com/about-us/case-studies which also falls under the Industrial Controls segment.
One of Spectris operating companies Red Lion Controls assisted to improve communication across four pump stations along an 11-mile pipeline, including four pump station RTU cabinets that sit along the pipeline, to deliver water to a treatment facility for Quantum. Quantum needed to leverage and improve the existing infrastructure while infusing modern technology. Red Lion Controls implemented a product that measures, monitors, controls and informs the product during the production process.
As the 11-mile pipeline is quite large, I can imagine it would have been costly for Quantum to implement Red Lion Controls new communication network. I am going to estimate the selling cost of this system would be around $1500 each as it is a 4G LTE cellular RTU and GPS control system. After further research, Red Lion’s RAM 600 celluar RTU’s feature up to five Ethernet ports and a RS-232 serial port. It also features a web-based engine that can trigger built in or send SMS text messages based on real-time operational data and can process in extreme conditions. I am going to estimate the variable costing would be roughly $400 including labour time for someone to construct this system and equipment.
Contribution Margin = Sales – Variable Costs
Sales 1500 – Variable 400
Contribution amount = 1100
What is the Contribution Margin telling us?
The contribution margin from the VC-8000 STEPOINT system, temperature monitoring system and RAM 600 cellular RTU was $14 000, $26 000 and $1100. The contribution margin traditionally tells us how much of the revenue will be available after the variable expenses are covered, for fixed expenses and then if any is left, it would (hopefully) go into the profit.
The variable costs would include labour, equipment for the systems and products being processed. However, the fixed costs for Spectris and their operating businesses (Brüel & Kjær Vibro, BTG, NDC Technologies, ESG Solutions, HBM, Millbrook, VI-grade, Omega Engineering, Malverm Panalytical, Particle Measuring systems, Concept Life Sciences, Red Lion controls and Servomex) could include electricity, rates, wages for staff etc.
As all Spectris contribution margins are above zero, they will all contribute to the profit of the organisations.
Constraints on Spectris
After reviewing reports and annual statistics, Spectris definitely seems like they are a competitive business and have quite a large volume of customers within each different segment. However, Spectris would also face some constraints. It is not uncommon that firms would face constraints. Constraints can alter or affect their decisions for the firm including products or services they offer.
As Spectris deliver its services from different operating businesses, (Brüel & Kjær Vibro, BTG, NDC Technologies, ESG Solutions, HBM, Millbrook, VI-grade, Omega Engineering, Malverm Panalytical, Particle Measuring systems, Concept Life Sciences, Red Lion controls and Servomex) and again in different segments, this offers the great possibility they will be faced with several constraints from each segment or operating business. These constraints could include competition from other suppliers, staffing issues and things such as supply shortages. Supply shortages could hold back overall sales growth. There is also the risk of potential product refreshers from Operating Businesses as they would go through different stages of products, and some may need updating. Spectris would have to take into consideration these possible constraints when making decisions. To combat these constraints, Spectris does a strategic review to assess each of the operating companies to determine their value creation potential and determine key attributes that are required to be a platform business.
Step 8
Please find Ratios spreadsheet attached with submission.
I was quite anxious going into step 8 as I was hoping I could complete the linking correctly and understand what the ratios were telling me. I am excited to learn more about my company through the financials.
Trying to calculate the share price was difficult to locate on my financial statements as there was a lot of figures. I ended up needing to control F and find the closing share price as putting “Share price” came up with a lot of results. I had to search this closing share price within each financial statement as they did not show in each other’s that I could locate. My understanding of the ‘Share Price’ is the dollar amount that investors want and are willing to pay for one share of the company’s stock and products. I was very interested in this ratio as I feel like so far Spectris do really well with their figures. Once I calculated the share price, I was happy to see the trend had become positive. In 2015, the amount that investors were wanting to invest which by 2018, it turned to 6 million – finish this
With the ordinary share price, I found this easy to locate on the financial spreadsheet. Once I calculated the share price, I was happy to see the trend had became positive. In 2015, the amount was 0.6 million which by 2018, it turned to 6 million.
Profitability Ratios
Profit margin = Profit after income tax (NPAT)/ sales. Within the profit margin ratio, my understanding is that it compares sales and demonstrates how well the company is actually doing and how much is returning into net profit. So, we would want to see it as a higher ratio, as the higher it is, the more profit is going into the company. What return are we gaining? After looking at Spectris Net Profit Margin ratio, I am very happy with the figures. From 2015, the net profit was 8.9% and began to get higher over the years. In 2018, the ratio was 13.7% which is a great improvement from 2015.
It is my understanding that Return on Assets (ROA) is an indicator of how efficient the company is at using its assets to actually generate the earnings. I can imagine that the higher the ratio, the better as this would mean the company was successfully handling the assets. Comparing Spectris ROA ratio, there is improvements from 2015 – 2018 by quite a lot. In 2015, the ratio was 7.3% which climbed to 10% in 2018. This means that in 2018, Spectris received 10% of the total assets back and earned $0.10 for every $1 it has in assets.
Efficiency Ratios
My understanding of the days of inventory is it is how long it is taking the company to sell the products. I found this section challenging and it was hard to determine what to select as the ‘daily cost of goods sold’. Looking at Spectris days of inventory, it was interesting that in 2015, the days totalled 131.41 and as the years went on, it improved drastically in 2017 with 97.61 to then spike again in2018 with 133.36 days. In my opinion, this is not a positive result as it is showing that from the time the product is produced, it stays in inventory for that period of time. However, if we assume Spectris maintains a constant quantity in its inventory, which is seems to by looking at the figures, there may be economic or competitive factors that are causing the high inventory days. I did a quick research and there are several high competitors with Spectris including Bruker, which has had funding go into the company with a total revenue of $3.9 billion, or Shimadzu with a revenue of $3.5 billion. This would definitely impact the sales that Spectris is producing, although still being quite competitive.
My understanding of total asset turnover ratio is it helps us to identify how efficient the company are using their assets and the sales created from the assets. Looking at Spectris total asset turnover ratio, it has not done very well as it is all averaging about 1-cent. I believe a good turnover ratio should be around 4 -6 from research and speaking with other students, as this usually means the rate which companies restock items is balanced.
Liquidity Ratios
Looking at the current ratio, it is my understanding that you are analysing and comparing the company’s current assets to its current liabilities and how well they pay for the current liabilities or short term obligations. For Spectris, the % has shifted from 2015 to 2018. In 2015, the current ratio is 2.96 and in 2018 it is 2.43. The current ratio for Spectris is telling us that they were able to pay their debts and short-term obligations. The higher the ratio, the more capable a company is to paying its obligations so although it did go down from 2015, I was quite happy to see Spectris Liquidity ratio was more than 1. These records indicate that Spectris is in good financial health. Although, because it didn’t really change from 2017 to 2018, this may mean that there was a weakness in the current ratio which includes the difficulty of comparing and measuring all the operating businesses or lack of trending information.
Financial Structure Ratios
My understanding of the Equity ratio is it is funded by shareholders and determines the portion of assets that are funded by debt or equity. Looking at Spectris 2018 figure, it was 58.9%, so for every dollar of assets that was funded by the equity investors, only roughly 58.9c was invested.
In relation to the Debt/ equity ratio, it is my understanding that this will show that for every dollar the equity investor is investing, how much is the bank or another contribution company actually is putting in to fund the business. In 2018, this was 69.8% which I believe is quite high, as this may show investors how much debt Spectris is in. It has increased from 2015. With only 51.0% and even 2017, which was only 49.4%.
Market Ratios
When I calculated the dividends per share it was quite large which made me question if I did it correctly. Listening to Maria’s video on Ratios, the dividends are meant to be low, as this is the amount paid out in dividends to shareholders and investors. Although as per the study guide chapter 4, dividends can be affected by a firm’s dividend policy, which then ultimately affects what is being transferred. After referring to the financial statement for 2018, Spectris proposed to pay a dividend of 40.5 pence ($0.78 Australian money), combined with the interim dividend of 20.5 pence ($0.39 Australian money), gives a total dividend of 61.0 pence ($1.17) per share. I am still not sure how the total dividends I have calculated within the ratios came to such a high number. It may be impacted from future investment needs.
The basic earnings per share is the difference between diluted (what if), earnings per share is what is based on profit. Comparing Spectris figures, I am pleased with the higher earnings however, was significantly reduced from 2015, $176.33 to 2018, $35.02. This is telling us Spectris’ profitability from its profit and shares. It is my understanding this is calculated to determine, for every share, how much have we earned. It is the total profit, spread across total number of shares and what they could have paid out to the company. This would need to be a larger figure as companies would rather retain earnings than provide to shares
My understanding of Price Earnings Ratio is the measurement of inflation of a shares and how long it will take to pay back with investment. I was a bit concerned when I saw Spectris figures at 0.07 for 2018 and even less in 2016 and 2015 at 0.01. My understanding is economic conditions can influence the Price Earnings ratio as they affect the financial market. Another reason why this figure may be so low, is the company may have increased its debt. This is a bit confusing as with the liquidity ratio, we can see Spectris is very successful with paying off the debt.
Ratios based on reformulated Financial Statements
The difference with this section of ratios is we have separated the operating and financial assets. I was really happy with the return on equity ratio as the trend is going in a positive direction from 2015 at 10.95% to 2018 of 17.04%. This tells me that Spectris are able to generate profits from its shareholders and investors of the company.
In relation to the Return on Net operating Assets I compared to RNOA under return on assets within Probability and trend is similar but when we separate the financing items, the return gets better and gives better identification on how Spectris is using their operational assets.
For the net borrowing costs, I can understand that we would be comparing this like an interest rate on loan. Spectris figures and percentages tell me good source of financing in the last two years as it is decreasing the cost of the loans from 2017 to 2018.
When I calculated the profit margin figure and compared it to the margin above I can understand that for every dollar of sales we are turning 13.1c (as per 2018) into operating income. I can see the trend is starting to increase and there not much difference with the profit margin in profitability ratios, in fact they are almost identical. The net profit margin is also telling me that most of the income is to do with operating activities.
My understanding of the total asset turnover is calculating how many times are we are turning over the dollar value of our assets into sales. I can imagine we would want to see a bigger figure and see that it is increasing. In relation to the Asset turnover, when I calculated the figure I compared to Total Asset Turnover in the Efficiency ratio. I noticed that the trends are similar but both slightly decreasing. This may mean that Spectris may not be utilising their assets to actually generate the sales. The turnover has improved when separating the finances out from the rations based on reformulated Financial Statements.
Economic profit
My understanding of Economic Profit is it calculates the total revenue received and also implies the costs for a firm. It is to measure the earnings of the firm. To work out the Economic profit, we can look at the main drivers which is Return on net operating assets (RNOA). RNOA is the Operating income after tax (OI) divided by the Net operating assets (NOA). For the weighted average cost of capital (WACC) I decided to use 11% as when I was searching the financial statements for Spectris from 2015 to 2018 it remained 11%. I was reluctant to use this percentage for WACC as the recommended figure from the assessment instructions was 10%. However, I decided to stick with what was on the financial statements as this also wouldn’t change much from 10% to 11% I imagine.
In 2018, the economic profit was $46.77, in 2017 it was $52.83, in 2016 it was $20.76 and in 2015 it was -$16.69. I was happy that most of the totals were positives. Spectris is trying to produce their goods to maximise the profit and the totals pf economic profit meant that the profit is a greater return than the WAAC. In 2015, as the profit did not go over the WACC which resulted in a negative economic profit. I was surprised considering how well Spectris did with its closing balance’s within the Statements of Movement in Equity, and the total of assets and liabilities. It had quite a large number of total operating assets and liabilities in 2015 through to 2018 including the NOA of $1584.20 in 2018. A firm’s normal profit is revenue, including explicit and hidden expenses, whereas the economic profit is the difference between the revenue received from the sale of an output and the cost of all the inputs used. From reading the study guide, it is my understanding that the economic profit is the ‘what if’ analysis for production levels. I believe the economic profit may have may resulted in a negative in 2015 from the hidden costs such as equipment, labour or production costs from the different operating business that weren’t taken into account. They may not have been taken into consideration in relation to the financial statement and accountants may not have included it.
Step 9
I actually really enjoyed completing this section of the assessment. I found it really interesting to put these figures in excel and work out the payback period for the two options.
Spectris is wanting to identify a group of potential operating businesses to expand the work capital and deliver greater value to a wider group of clients. To do this, they are considering investing in two operating businesses. The first option is Instrument Solutions and the second option of investment is Ergon Energy. Currently Spectris has several operating businesses that operate and supply award-winning productivity-enhancing instrumentation and control systems and products to a wide variety of customers globally. There is now an opportunity for Sprectris to expand its operating businesses and invest to gain further economic growth.
As there are several other businesses and investors that Instrument Solutions and Ergon Energy may have, it is suggested that each of these products be given the length of 10 years. Managers need to decide and make decisions that will affect the business long-term and it is a goal for making long-term capital investments These two choices of investment are expected to provide benefit in many years in the future. Spectris’s aim is sales growth and to become a more focussed and simplified business, which is highlighted several times in their financial statements. The cash flows generated by both of these businesses would ensure profit is going back into equipment and resources for the systems, technically demanding industrial applications and products that Spectris and its operating businesses use each year. It will also contribute to staff wages and marketing of Spectris. While choosing the right investment we have to consider, would this investment create us value for long-term decisions? As once you commit to these long-term investments, it is not easy to reverse or go back on the investment decision. There is the benefit of both options being an Independent project meaning the cash flow of one investment are unaffected by the acceptance of the other investment.
The investment will begin on January 1, 2021 and the estimated future cash flows are expected to be received on 31 December of each year. The estimated cost, the estimated years, residual value and estimate future cash flows of each investment opportunity are set out in the table below. All amounts are express in Australian Dollars AUD. We are going to assume the rate of return/ discount rate/ WACC of 11% as this is the same as I used with my ratio, which was the WACC I found for Spectris within the financial statement. We are going to estimate that Instrumentation control sell products for 2m and Ergon Energy sell products for 3m.
| Instrument Solutions | Ergon Energy | |
| Original Cost | $55 million | $70 million |
| Estimated years | 10 years | 10 years |
| Residual vision | $2 million | $3 million |
| Estimated future cash flows: | ||
| Year 1 – 31 December 2021 | -3 million | – 5 million |
| Year 2 – 31 December 2022 | $10 million | $12 million |
| Year 3 – 31 December 2023 | $15 million | $22 million |
| Year 4 – 31 December 2024 | $20 million | $11 million |
| Year 5 – 31 December 2025 | $25 million | $25 million |
| Year 6 – 31 December 2026 | $11 million | $17 million |
| Year 7 – 31 December 2027 | $16 million | $10 million |
| Year 8 – 31 December 2028 | $21 million | $18 million |
| Year 9 – 31 December 2029 | $7 million | $8 million |
| Year 10 – 31 December 2030 | $13 million | $14 million |
Please find below the Net Present value (NPV), internal rate of return (IRR), and the payback period for each option of investment. Again, the discount rate is 11% and the NPV has been calculated using this rate. The below figures are all displayed in Australian Currency (AUD).
| Instrument Solutions | Ergon Energy | |
| Net Present Value (NPV) | $20.11 | $3.18 |
| Internal Rate of Return (IRR) | 17.6% | 12% |
| Payback period | 4.52 years | 5.29 years |
The Net Present Value (NPV is essentially the difference between the present value of cash flows over a period of time. I have used this formula to analyse the profitability of my two investment options. While calculating the NPV of the each of my options of investment for Sprectris, I was really looking for a positive NPV as this will indicate that the investment would add value to the firm. Having a positive NPV would highlight that the firm will get more back than the cost of the capital. Both Instrumentation Solutions and Ergon energy both has positive NPV, although Instrument Solutions NPV is greater, this gives a more competitive edge.
With the Internal Rate of Return (IRR), we are measuring the investment rate of return. We are using this context savings and loans on the investment and we need it higher than the discounted rate of 11%. Again, the higher the rate the better as we need to ensure the return of the investment will outweigh the actual cost of the investment. If the IRR is negative, there would be no reason to consider the investment option as it would not give a good return. The IRR rate for Instrument Solution is 17.6% where as Ergon Energy was 12%. Although both of these investment options are is higher than discount rate, Instrument Solutions have exceeded the IRR a lot more than Ergon energy, which again, gives Instrumentation Solutions a leading edge.
The payback period refers to how many years it would take for the initial cost of the project/ investment to be earned back to Spectris from the cash flows that were estimated. We need to ensure that the payback period doesn’t exceed the initial estimated years for the investment. If it does, there would be no reason to take the investment. For option 1, Instrument Solutions occurs in approx 4.52 years. The payback period for Ergon Energy is 5.29 years. Again, if Spectris chose option 1, Instrument Solutions, they will receive the initial cost of the investment back earlier.
The main weaknesses I can see with these investment options is that the cash flows are estimations which would clearly really impact all the figures associated with the investments as it is not a true representation of the figures. I can imagine it would be difficult to really understand and know each cash flow. There are also several weaknesses with the NPV, IRR and the Pay back period. The payback period ignores the time value or money and it does not adjust or account for differences in the over all investment, which may impact the time in which the company received the initial cost of investment. This method also does not take into consideration the cash flows after pay back, therefor the company may not have a true representation to determine if the investment will be worth it or not. The weakness associated with NPV is it is very reliant and sensitive to the discount rate, which therefor would be easy to manipulate and change. Any changes in the discount rate would mean big changes to the NPV. In relation to the IRR, the weakness of this method would include potential unrealistic assumptions about the reinvestment of funds.
Based on the figures above, even with the weaknesses, Spectris should chose option 1 of Instrumentation Control as it had the best payback period, NPV and IRR compared to option 2 of Ergon Energy.
Going into step 7, I was quite nervous, as I knew it would be difficult to choose some products that Spectris sell as it is so broad and they do offer multiple services around the world. Their products fall under different business segments including Materials Analysis, Test and Measurement, In-line instrumentation and industrial controls. They do also have several operating companies including Brüel & Kjær Vibro, BTG, NDC Technologies, ESG Solutions, HBM, Millbrook, VI-grade, Omega Engineering, Malverm Panalytical, Particle Measuring systems, Concept Life Scienes, Red Lion controls and Servomex which they manufacture, produce and sell products to consumers. These companies fall under the different business segments. As the there is so many products that Spectris can supply within different segments, I conducted further research and decided to base the products of case studies from products that Spectris has previously supplied from their operating businesses as it was easier to determine the products Spectris would sell. I was not so confident with trying to determine the cost of each of the products as I had never associated with them and I also could not locate any pricing information on the Spectris home page or form any reports so I know I will really have to guess the pricing of the products. I was also nervous about determining the variable costs and contribution costs. After I estimate the selling price and variable costs, I will be able to determine the Contribution Margin. I also found it helpful to refer to the Spectris Corporate spreadsheet – https://www.spectris.com/~/media/Files/S/Spectris/documents/signpost-docs/spectris-factsheet-march-2019.pdf.
First product from Spectris:
The first product falls under the Test and Measurement segment that Brüel & Kjær Vibro completed. Link to case study – https://www.spectris.com/about-us/case-studies
I really had no idea how much a VC-8000 STEPOINT system would cost. I had never heard of this system before and didn’t really know what it would entail. Based on reading the case study, I can see understand that the system provides both protection and condition monitoring of the generating units for the 250 gas-goal fired steam turbine. This system is using for continuous machine monitoring to fit specific needs. I have decided to base my figures off the Spectris Corporate spreadsheet. The sales within the Test and Measurement were a total of £522.6m. I’m going to estimate that to purchase the VC-8000 STEPOINT system it will be roughly $20 000 as I can imagine. I am going to estimate the variable costings to be 30% of the sale price, totalling $6000. I did again refer to the Spectris Corporate spreadsheet for this. This variable costing would include labour costs and equipment needed to construct the system.
Contribution Margin = Sales – Variable Costs
Sales 20 000 – Variable 6000
Contribution amount = 14 000
Second product from Spectris:
The second product I received from this case study – https://www.spectris.com/about-us/case-studies which falls under the segment of Industrial Controls.
Spectris’s operating business Omega Engineering created a temperature monitoring system that also includes data automation that makes food safety compliance more effective. They constructed this system for the Food Innovation Centre at Rutgers University (FIC). FIC is a unique food business incubator and accelerator. They work to ensure food safety training amongst organisations and have a compliance and inspection process, thus needing gold standard of food safety constantly. Omega Engineering took that opportunity to enhance FIC monitoring solution and created a system that did more than just ‘monitor food temperature’. This system was designed to develop an automated wireless temperature monitoring and data analytics solution for FIC, which also includes receiving alerts when areas are falling under the correct temperature.
Again, I was not sure what this system would cost. General small food temperature monitoring equipment for a domestic household could range anywhere from $20 – $200 so I am definitely going to estimate this system, being so large and would take a lot of time, energy and resources, would be roughly $40 000 to implement. I am going to estimate the variable costs will be roughly 35% as it would take a lot of labour time to construct the system and all equipment involved. Variable cost would work out to be $14 000.
Contribution Margin = Sales – Variable Costs
Sales 40 000 – Variable 14 000
Contribution amount = 26 000
Third product from Spectris:
The third product is from case study https://www.spectris.com/about-us/case-studies which also falls under the Industrial Controls segment.
One of Spectris operating companies Red Lion Controls assisted to improve communication across four pump stations along an 11-mile pipeline, including four pump station RTU cabinets that sit along the pipeline, to deliver water to a treatment facility for Quantum. Quantum needed to leverage and improve the existing infrastructure while infusing modern technology. Red Lion Controls implemented a product that measures, monitors, controls and informs the product during the production process.
As the 11-mile pipeline is quite large, I can imagine it would have been costly for Quantum to implement Red Lion Controls new communication network. I am going to estimate the selling cost of this system would be around $1500 each as it is a 4G LTE cellular RTU and GPS control system. After further research, Red Lion’s RAM 600 celluar RTU’s feature up to five Ethernet ports and a RS-232 serial port. It also features a web-based engine that can trigger built in or send SMS text messages based on real-time operational data and can process in extreme conditions. I am going to estimate the variable costing would be roughly $400 including labour time for someone to construct this system and equipment.
Contribution Margin = Sales – Variable Costs
Sales 1500 – Variable 400
Contribution amount = 1100
What is the Contribution Margin telling us?
The contribution margin from the VC-8000 STEPOINT system, temperature monitoring system and RAM 600 cellular RTU was $14 000, $26 000 and $1100. The contribution margin traditionally tells us how much of the revenue will be available after the variable expenses are covered, for fixed expenses and then if any is left, it would (hopefully) go into the profit.
The variable costs would include labour, equipment for the systems and products being processed. However, the fixed costs for Spectris and their operating businesses (Brüel & Kjær Vibro, BTG, NDC Technologies, ESG Solutions, HBM, Millbrook, VI-grade, Omega Engineering, Malverm Panalytical, Particle Measuring systems, Concept Life Sciences, Red Lion controls and Servomex) could include electricity, rates, wages for staff etc.
As all Spectris contribution margins are above zero, they will all contribute to the profit of the organisations.
Constraints on Spectris
After reviewing reports and annual statistics, Spectris definitely seems like they are a competitive business and have quite a large volume of customers within each different segment. However, Spectris would also face some constraints. It is not uncommon that firms would face constraints. Constraints can alter or affect their decisions for the firm including products or services they offer.
As Spectris deliver its services from different operating businesses, (Brüel & Kjær Vibro, BTG, NDC Technologies, ESG Solutions, HBM, Millbrook, VI-grade, Omega Engineering, Malverm Panalytical, Particle Measuring systems, Concept Life Sciences, Red Lion controls and Servomex) and again in different segments, this offers the great possibility they will be faced with several constraints from each segment or operating business. These constraints could include competition from other suppliers, staffing issues and things such as supply shortages. Supply shortages could hold back overall sales growth. There is also the risk of potential product refreshers from Operating Businesses as they would go through different stages of products, and some may need updating. Spectris would have to take into consideration these possible constraints when making decisions. To combat these constraints, Spectris does a strategic review to assess each of the operating companies to determine their value creation potential and determine key attributes that are required to be a platform business.
Step 8
Please find Ratios spreadsheet attached with submission.
I was quite anxious going into step 8 as I was hoping I could complete the linking correctly and understand what the ratios were telling me. I am excited to learn more about my company through the financials.
Trying to calculate the share price was difficult to locate on my financial statements as there was a lot of figures. I ended up needing to control F and find the closing share price as putting “Share price” came up with a lot of results. I had to search this closing share price within each financial statement as they did not show in each other’s that I could locate. My understanding of the ‘Share Price’ is the dollar amount that investors want and are willing to pay for one share of the company’s stock and products. I was very interested in this ratio as I feel like so far Spectris do really well with their figures. Once I calculated the share price, I was happy to see the trend had become positive. In 2015, the amount that investors were wanting to invest which by 2018, it turned to 6 million – finish this
With the ordinary share price, I found this easy to locate on the financial spreadsheet. Once I calculated the share price, I was happy to see the trend had became positive. In 2015, the amount was 0.6 million which by 2018, it turned to 6 million.
Profitability Ratios
Profit margin = Profit after income tax (NPAT)/ sales. Within the profit margin ratio, my understanding is that it compares sales and demonstrates how well the company is actually doing and how much is returning into net profit. So, we would want to see it as a higher ratio, as the higher it is, the more profit is going into the company. What return are we gaining? After looking at Spectris Net Profit Margin ratio, I am very happy with the figures. From 2015, the net profit was 8.9% and began to get higher over the years. In 2018, the ratio was 13.7% which is a great improvement from 2015.
It is my understanding that Return on Assets (ROA) is an indicator of how efficient the company is at using its assets to actually generate the earnings. I can imagine that the higher the ratio, the better as this would mean the company was successfully handling the assets. Comparing Spectris ROA ratio, there is improvements from 2015 – 2018 by quite a lot. In 2015, the ratio was 7.3% which climbed to 10% in 2018. This means that in 2018, Spectris received 10% of the total assets back and earned $0.10 for every $1 it has in assets.
Efficiency Ratios
My understanding of the days of inventory is it is how long it is taking the company to sell the products. I found this section challenging and it was hard to determine what to select as the ‘daily cost of goods sold’. Looking at Spectris days of inventory, it was interesting that in 2015, the days totalled 131.41 and as the years went on, it improved drastically in 2017 with 97.61 to then spike again in2018 with 133.36 days. In my opinion, this is not a positive result as it is showing that from the time the product is produced, it stays in inventory for that period of time. However, if we assume Spectris maintains a constant quantity in its inventory, which is seems to by looking at the figures, there may be economic or competitive factors that are causing the high inventory days. I did a quick research and there are several high competitors with Spectris including Bruker, which has had funding go into the company with a total revenue of $3.9 billion, or Shimadzu with a revenue of $3.5 billion. This would definitely impact the sales that Spectris is producing, although still being quite competitive.
My understanding of total asset turnover ratio is it helps us to identify how efficient the company are using their assets and the sales created from the assets. Looking at Spectris total asset turnover ratio, it has not done very well as it is all averaging about 1-cent. I believe a good turnover ratio should be around 4 -6 from research and speaking with other students, as this usually means the rate which companies restock items is balanced.
Liquidity Ratios
Looking at the current ratio, it is my understanding that you are analysing and comparing the company’s current assets to its current liabilities and how well they pay for the current liabilities or short term obligations. For Spectris, the % has shifted from 2015 to 2018. In 2015, the current ratio is 2.96 and in 2018 it is 2.43. The current ratio for Spectris is telling us that they were able to pay their debts and short-term obligations. The higher the ratio, the more capable a company is to paying its obligations so although it did go down from 2015, I was quite happy to see Spectris Liquidity ratio was more than 1. These records indicate that Spectris is in good financial health. Although, because it didn’t really change from 2017 to 2018, this may mean that there was a weakness in the current ratio which includes the difficulty of comparing and measuring all the operating businesses or lack of trending information.
Financial Structure Ratios
My understanding of the Equity ratio is it is funded by shareholders and determines the portion of assets that are funded by debt or equity. Looking at Spectris 2018 figure, it was 58.9%, so for every dollar of assets that was funded by the equity investors, only roughly 58.9c was invested.
In relation to the Debt/ equity ratio, it is my understanding that this will show that for every dollar the equity investor is investing, how much is the bank or another contribution company actually is putting in to fund the business. In 2018, this was 69.8% which I believe is quite high, as this may show investors how much debt Spectris is in. It has increased from 2015. With only 51.0% and even 2017, which was only 49.4%.
Market Ratios
When I calculated the dividends per share it was quite large which made me question if I did it correctly. Listening to Maria’s video on Ratios, the dividends are meant to be low, as this is the amount paid out in dividends to shareholders and investors. Although as per the study guide chapter 4, dividends can be affected by a firm’s dividend policy, which then ultimately affects what is being transferred. After referring to the financial statement for 2018, Spectris proposed to pay a dividend of 40.5 pence ($0.78 Australian money), combined with the interim dividend of 20.5 pence ($0.39 Australian money), gives a total dividend of 61.0 pence ($1.17) per share. I am still not sure how the total dividends I have calculated within the ratios came to such a high number. It may be impacted from future investment needs.
The basic earnings per share is the difference between diluted (what if), earnings per share is what is based on profit. Comparing Spectris figures, I am pleased with the higher earnings however, was significantly reduced from 2015, $176.33 to 2018, $35.02. This is telling us Spectris’ profitability from its profit and shares. It is my understanding this is calculated to determine, for every share, how much have we earned. It is the total profit, spread across total number of shares and what they could have paid out to the company. This would need to be a larger figure as companies would rather retain earnings than provide to shares
My understanding of Price Earnings Ratio is the measurement of inflation of a shares and how long it will take to pay back with investment. I was a bit concerned when I saw Spectris figures at 0.07 for 2018 and even less in 2016 and 2015 at 0.01. My understanding is economic conditions can influence the Price Earnings ratio as they affect the financial market. Another reason why this figure may be so low, is the company may have increased its debt. This is a bit confusing as with the liquidity ratio, we can see Spectris is very successful with paying off the debt.
Ratios based on reformulated Financial Statements
The difference with this section of ratios is we have separated the operating and financial assets. I was really happy with the return on equity ratio as the trend is going in a positive direction from 2015 at 10.95% to 2018 of 17.04%. This tells me that Spectris are able to generate profits from its shareholders and investors of the company.
In relation to the Return on Net operating Assets I compared to RNOA under return on assets within Probability and trend is similar but when we separate the financing items, the return gets better and gives better identification on how Spectris is using their operational assets.
For the net borrowing costs, I can understand that we would be comparing this like an interest rate on loan. Spectris figures and percentages tell me good source of financing in the last two years as it is decreasing the cost of the loans from 2017 to 2018.
When I calculated the profit margin figure and compared it to the margin above I can understand that for every dollar of sales we are turning 13.1c (as per 2018) into operating income. I can see the trend is starting to increase and there not much difference with the profit margin in profitability ratios, in fact they are almost identical. The net profit margin is also telling me that most of the income is to do with operating activities.
My understanding of the total asset turnover is calculating how many times are we are turning over the dollar value of our assets into sales. I can imagine we would want to see a bigger figure and see that it is increasing. In relation to the Asset turnover, when I calculated the figure I compared to Total Asset Turnover in the Efficiency ratio. I noticed that the trends are similar but both slightly decreasing. This may mean that Spectris may not be utilising their assets to actually generate the sales. The turnover has improved when separating the finances out from the rations based on reformulated Financial Statements.
Economic profit
My understanding of Economic Profit is it calculates the total revenue received and also implies the costs for a firm. It is to measure the earnings of the firm. To work out the Economic profit, we can look at the main drivers which is Return on net operating assets (RNOA). RNOA is the Operating income after tax (OI) divided by the Net operating assets (NOA). For the weighted average cost of capital (WACC) I decided to use 11% as when I was searching the financial statements for Spectris from 2015 to 2018 it remained 11%. I was reluctant to use this percentage for WACC as the recommended figure from the assessment instructions was 10%. However, I decided to stick with what was on the financial statements as this also wouldn’t change much from 10% to 11% I imagine.
In 2018, the economic profit was $46.77, in 2017 it was $52.83, in 2016 it was $20.76 and in 2015 it was -$16.69. I was happy that most of the totals were positives. Spectris is trying to produce their goods to maximise the profit and the totals pf economic profit meant that the profit is a greater return than the WAAC. In 2015, as the profit did not go over the WACC which resulted in a negative economic profit. I was surprised considering how well Spectris did with its closing balance’s within the Statements of Movement in Equity, and the total of assets and liabilities. It had quite a large number of total operating assets and liabilities in 2015 through to 2018 including the NOA of $1584.20 in 2018. A firm’s normal profit is revenue, including explicit and hidden expenses, whereas the economic profit is the difference between the revenue received from the sale of an output and the cost of all the inputs used. From reading the study guide, it is my understanding that the economic profit is the ‘what if’ analysis for production levels. I believe the economic profit may have may resulted in a negative in 2015 from the hidden costs such as equipment, labour or production costs from the different operating business that weren’t taken into account. They may not have been taken into consideration in relation to the financial statement and accountants may not have included it.
Step 9
I actually really enjoyed completing this section of the assessment. I found it really interesting to put these figures in excel and work out the payback period for the two options.
Spectris is wanting to identify a group of potential operating businesses to expand the work capital and deliver greater value to a wider group of clients. To do this, they are considering investing in two operating businesses. The first option is Instrument Solutions and the second option of investment is Ergon Energy. Currently Spectris has several operating businesses that operate and supply award-winning productivity-enhancing instrumentation and control systems and products to a wide variety of customers globally. There is now an opportunity for Sprectris to expand its operating businesses and invest to gain further economic growth.
As there are several other businesses and investors that Instrument Solutions and Ergon Energy may have, it is suggested that each of these products be given the length of 10 years. Managers need to decide and make decisions that will affect the business long-term and it is a goal for making long-term capital investments These two choices of investment are expected to provide benefit in many years in the future. Spectris’s aim is sales growth and to become a more focussed and simplified business, which is highlighted several times in their financial statements. The cash flows generated by both of these businesses would ensure profit is going back into equipment and resources for the systems, technically demanding industrial applications and products that Spectris and its operating businesses use each year. It will also contribute to staff wages and marketing of Spectris. While choosing the right investment we have to consider, would this investment create us value for long-term decisions? As once you commit to these long-term investments, it is not easy to reverse or go back on the investment decision. There is the benefit of both options being an Independent project meaning the cash flow of one investment are unaffected by the acceptance of the other investment.
The investment will begin on January 1, 2021 and the estimated future cash flows are expected to be received on 31 December of each year. The estimated cost, the estimated years, residual value and estimate future cash flows of each investment opportunity are set out in the table below. All amounts are express in Australian Dollars AUD. We are going to assume the rate of return/ discount rate/ WACC of 11% as this is the same as I used with my ratio, which was the WACC I found for Spectris within the financial statement. We are going to estimate that Instrumentation control sell products for 2m and Ergon Energy sell products for 3m.
| Instrument Solutions | Ergon Energy | |
| Original Cost | $55 million | $70 million |
| Estimated years | 10 years | 10 years |
| Residual vision | $2 million | $3 million |
| Estimated future cash flows: | ||
| Year 1 – 31 December 2021 | -3 million | – 5 million |
| Year 2 – 31 December 2022 | $10 million | $12 million |
| Year 3 – 31 December 2023 | $15 million | $22 million |
| Year 4 – 31 December 2024 | $20 million | $11 million |
| Year 5 – 31 December 2025 | $25 million | $25 million |
| Year 6 – 31 December 2026 | $11 million | $17 million |
| Year 7 – 31 December 2027 | $16 million | $10 million |
| Year 8 – 31 December 2028 | $21 million | $18 million |
| Year 9 – 31 December 2029 | $7 million | $8 million |
| Year 10 – 31 December 2030 | $13 million | $14 million |
Please find below the Net Present value (NPV), internal rate of return (IRR), and the payback period for each option of investment. Again, the discount rate is 11% and the NPV has been calculated using this rate. The below figures are all displayed in Australian Currency (AUD).
| Instrument Solutions | Ergon Energy | |
| Net Present Value (NPV) | $20.11 | $3.18 |
| Internal Rate of Return (IRR) | 17.6% | 12% |
| Payback period | 4.52 years | 5.29 years |
The Net Present Value (NPV is essentially the difference between the present value of cash flows over a period of time. I have used this formula to analyse the profitability of my two investment options. While calculating the NPV of the each of my options of investment for Sprectris, I was really looking for a positive NPV as this will indicate that the investment would add value to the firm. Having a positive NPV would highlight that the firm will get more back than the cost of the capital. Both Instrumentation Solutions and Ergon energy both has positive NPV, although Instrument Solutions NPV is greater, this gives a more competitive edge.
With the Internal Rate of Return (IRR), we are measuring the investment rate of return. We are using this context savings and loans on the investment and we need it higher than the discounted rate of 11%. Again, the higher the rate the better as we need to ensure the return of the investment will outweigh the actual cost of the investment. If the IRR is negative, there would be no reason to consider the investment option as it would not give a good return. The IRR rate for Instrument Solution is 17.6% where as Ergon Energy was 12%. Although both of these investment options are is higher than discount rate, Instrument Solutions have exceeded the IRR a lot more than Ergon energy, which again, gives Instrumentation Solutions a leading edge.
The payback period refers to how many years it would take for the initial cost of the project/ investment to be earned back to Spectris from the cash flows that were estimated. We need to ensure that the payback period doesn’t exceed the initial estimated years for the investment. If it does, there would be no reason to take the investment. For option 1, Instrument Solutions occurs in approx 4.52 years. The payback period for Ergon Energy is 5.29 years. Again, if Spectris chose option 1, Instrument Solutions, they will receive the initial cost of the investment back earlier.
The main weaknesses I can see with these investment options is that the cash flows are estimations which would clearly really impact all the figures associated with the investments as it is not a true representation of the figures. I can imagine it would be difficult to really understand and know each cash flow. There are also several weaknesses with the NPV, IRR and the Pay back period. The payback period ignores the time value or money and it does not adjust or account for differences in the over all investment, which may impact the time in which the company received the initial cost of investment. This method also does not take into consideration the cash flows after pay back, therefor the company may not have a true representation to determine if the investment will be worth it or not. The weakness associated with NPV is it is very reliant and sensitive to the discount rate, which therefor would be easy to manipulate and change. Any changes in the discount rate would mean big changes to the NPV. In relation to the IRR, the weakness of this method would include potential unrealistic assumptions about the reinvestment of funds.
Based on the figures above, even with the weaknesses, Spectris should chose option 1 of Instrumentation Control as it had the best payback period, NPV and IRR compared to option 2 of Ergon Energy.
Based on the figures above, even with the weaknesses, Spectris should chose option 1 of Instrumentation Control as it had the best payback period, NPV and IRR compared to option 2 of Ergon Energy.
Spectris Financial Statements Reinstated
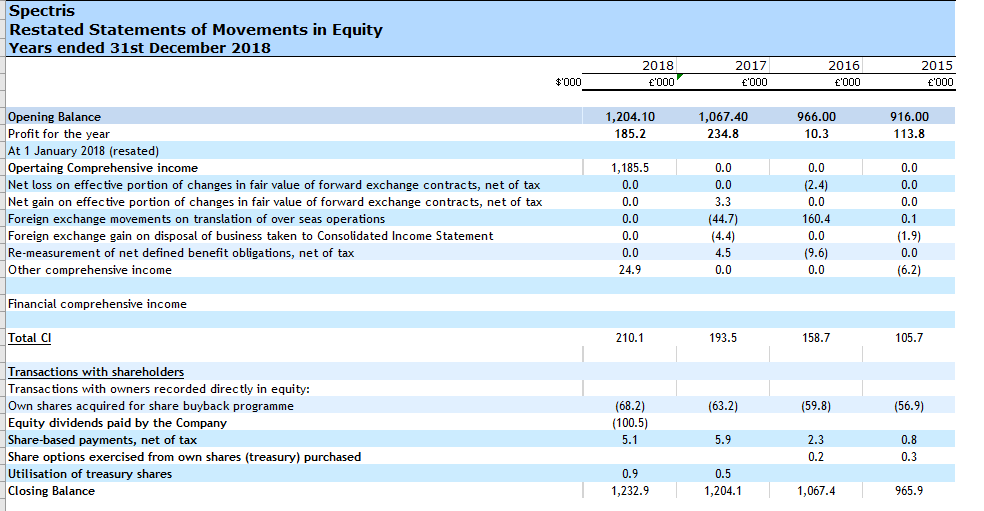
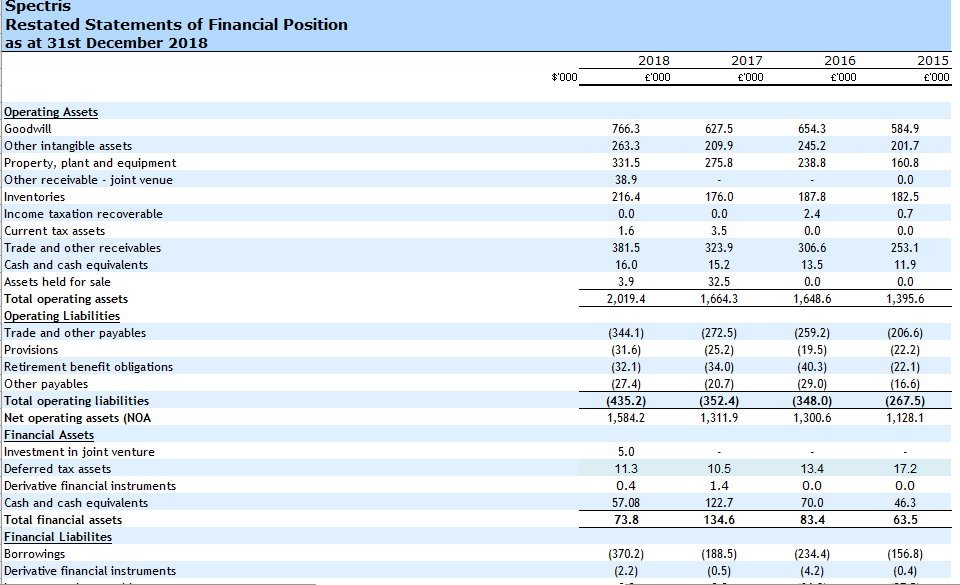
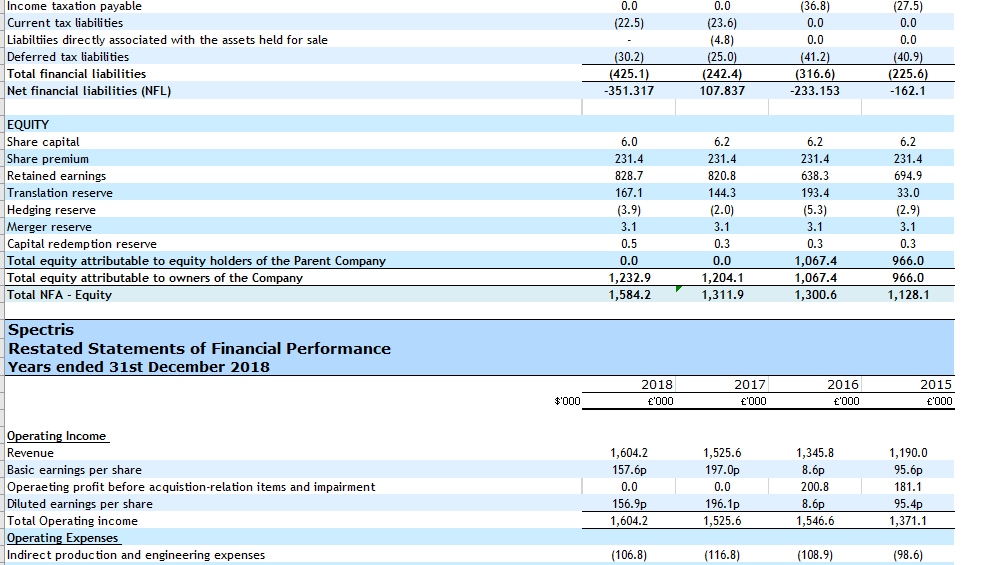
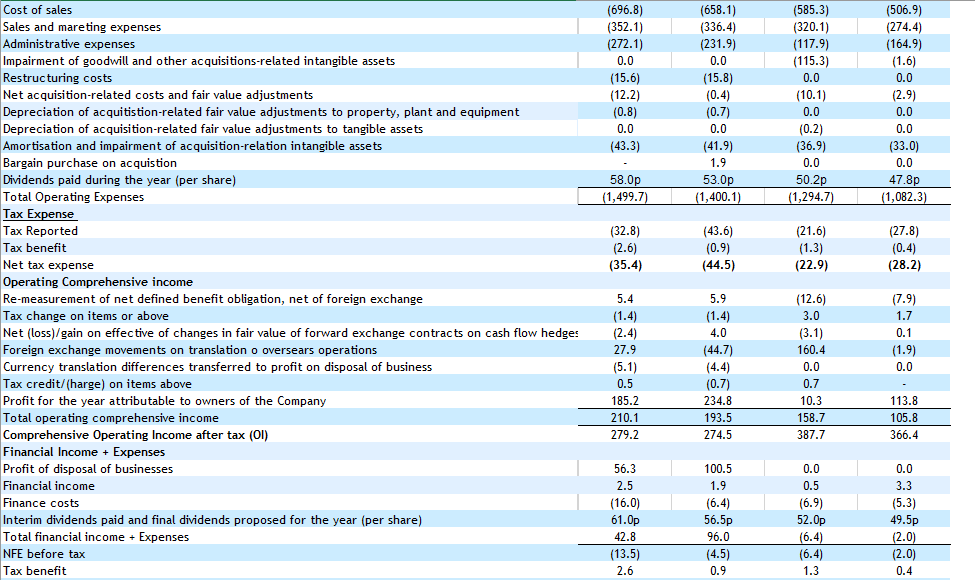
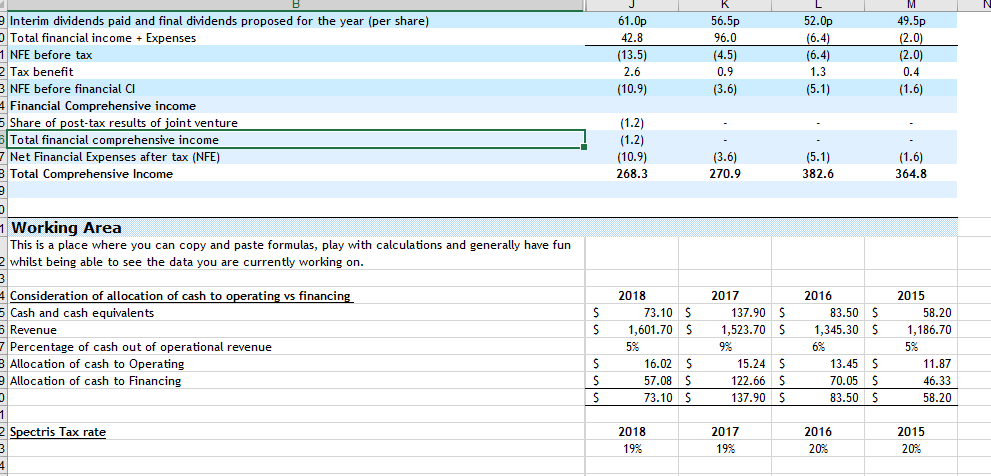
ASS#2 Step 3 – Theory
Starting chapter 3, I was very anxious! I had to go back and read chapter 4 as a refresher, even then I still felt overwhelmed as filling the Company spreadsheet first of all was quite hard. I went in with an open mind but I knew this whole step would take quite some time. I am still struggling with understanding some of the concepts and still find myself referring to the cheat sheet for abbreviations, but I feel after completing this step, I have a better understanding of what everything means and how they all interact, influence and contribute to each other.
First, I did struggle with separating operating and financial activities. I did have to read some sections within the study guide and do some research to really understand the differences. I found this quite hard. My understanding is that things that contribute directly to the organisation and how it operates is operational, including interactions with the product, customers, suppliers and input markets. This may also include decisions within the firm such as selling products or what assets to acquire. The financial activities of a firm include the firms interactions with debtors and equity etc. But what happens when there’s something that could fall under both, or neither? This is what I struggled with most, especially within the Income Statement and restating it. This section took me the longest out of all of it. It also took me quite some time to understand how to link the records. I was watching the videos by Maria but I was still ensure what she was actually tying, clicking or highlighting. I thought ang assumed I could just simply copy and paste, which was not the case. When I understood you could press ‘=’ and select the cell, I felt more confident with being able to link the records. Also being able to drag the cell across, to have all the totals or records brought over was quite handy knowledge to have. This saved me time in going in and linking every single record. It was helpful to be able to just have the first one linked and the rest would follow.
Restating Changes in Equity
I quickly realised when restating that something wasn’t right. The figures seemed wrong, nothing was totalling, and I had a sense that I was missing something. I went referred to my company’s financial statements again to ensure I had everything right and all the amounts were correct. I quickly found that I had in fact entered things in correctly or missed things. I have no idea how I’ve managed to do that! But the important thing is I had realised it was wrong and fix it. I went back and modified some figures and added things I had missed. I had to pretty much do the whole changes in equity sheet again. I do not know where I got the figures the first time, but it wasn’t right! I thought I may have been looking and referring to the wrong statement. I have no idea what happened. I remember feeling confused with entering the figures for the Company spreadsheet. I can see now that when restating, it also gives you the opportunity to check all the figures again, especially if they don’t total. I was happy restating my changes in equity as it totalled. I was also happy when I went back and changed my company spreadsheet that everything matched and totalled. For example, when I first handed the company spreadsheet in, the figures and totals within the balance sheet did not match my changes in equity. After making the changes, my total within my balance sheet match the SOCIE and I was quite proud of myself that I managed to go back and fix these errors. This spreadsheet I found easier than most as it was smaller records to input and restate. I also understood this section of the study guide, compared to the Balance sheet and Income statement.
Restating Balance Sheet
When beginning to restate the Balance sheet, I quickly realised it was going to be the same situation as with the changes in equity. I had to go back and compare the figures again, as I somehow also managed to enter the records and calculated the totals incorrectly. Again, I was glad that I did that and realised this error as it was then easier to go and restate the balance sheet. I pretty much had to do the whole balance sheet again from the original records. It was a long process, which took me probably longer than most, but I was very satisfied by the end when the totals matched, especially with the SOCIE. I actually enjoyed restating the balance sheet. I still found it hard to separate the operating and financial, however, I had an idea of the differences between the two, so I was slightly confident I was doing it correctly. However, when I went to calculate the NFA and Equity, it was not matching. I referred back to the video to ensure I was completing the right checks. This was a very time consuming and frustrating process. I completed the checks and ensure the OA + FA = Total assets in original financials, OL + FL = Total liabilities in original finances and also confirming the equity matches the restated CI equity. This took some time do complete but I was happy that I did this, as I found the equity was not the same compared to the original financial statement. The whole process was very over whelming at first but surprisingly by the end I was getting used to it. By the end everything did match in 2017, 2016 and 2015 but I did need to change one amount that I had entered, when also going back and referring to the financial statements. I was actually using NFA + Equity, when I should have been using NFA – Equity. After making these changes, the NFA – Equity matched the NOA and I was very happy! I can see how important it is to complete the checks and refer back to the original financial statements to ensure everything is correct.
I had a big of trouble truing to complete the splitting cash section. I did need to refer to the study guide to remember why I was doing this. This section I soon realised, was holding cash for operating usage. Also, within the video, I remembered that up to 1% of cash should be used for operational use. When adding these totals within the working area of the restated financial statements, I felt more confident with that I was doing while following along with Maria. I was happy that I did this section correctly the first time.
Restating Income Statement
I found restating the Income statement extremely difficult and a long process. I didn’t have totals from the Financial Statement to refer to such as ‘total expenses’ etc so I was not sure I was doing it correctly. I found it really hard to differentiate between O and F in the Income statements, especially as mine was very different to Maria’s in terms of lay out. I again went back to ensure all my amounts and records I have entered were correct and that I wasn’t missing anything. Everything seemed in place. I was following the structure that Maria had told us to follow (Operating: Income, Expense, Tax benefit, CI and Financial: Income, Expense, Tax benefit and CI – OI + NFE = Original CI) but I knew I was doing it wrong as I believed I did not have the correct differentiation for operating and financial activities. It was very hard not to have totals and my financial statements not laid out.
I could not get the Total comprehensive income to match. This was very difficult as I couldn’t understand why. I checked it again and again and re read the study guide but I still did not know what I had done wrong. It seemed to me it was different figures and amounts, comparing the comprehensive income to the Income statement and the Changes in Equity. I then went back again and referred to the financial statements. I had a long look at the 2018/2017 information and realised I had put the incorrect operating activity information in. After making these changes, the total was the same as the changes in equity. I found the tax section was quite confusing! It was good to follow along with Maria, however it was still very difficult.
Unfortunately, I could not get the comprehensive income to match, even after going back and re watching sections of the video and comparing records to the original financial statements. I was very upset at this section as I couldn’t understand what went wrong! I am looking forward to some feedback from Maria.
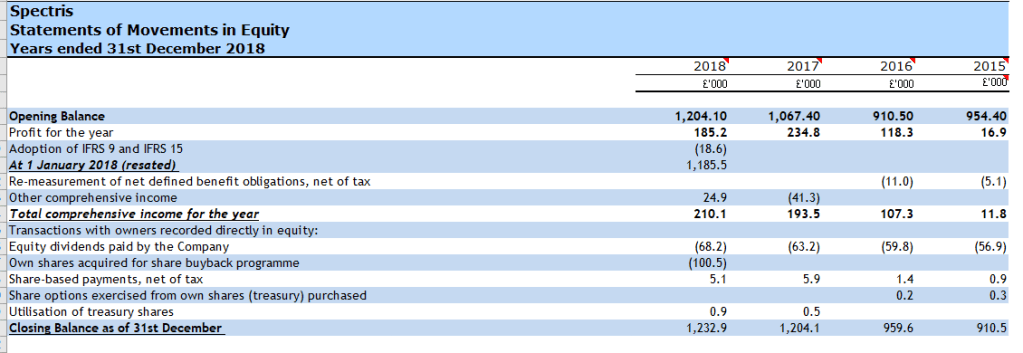
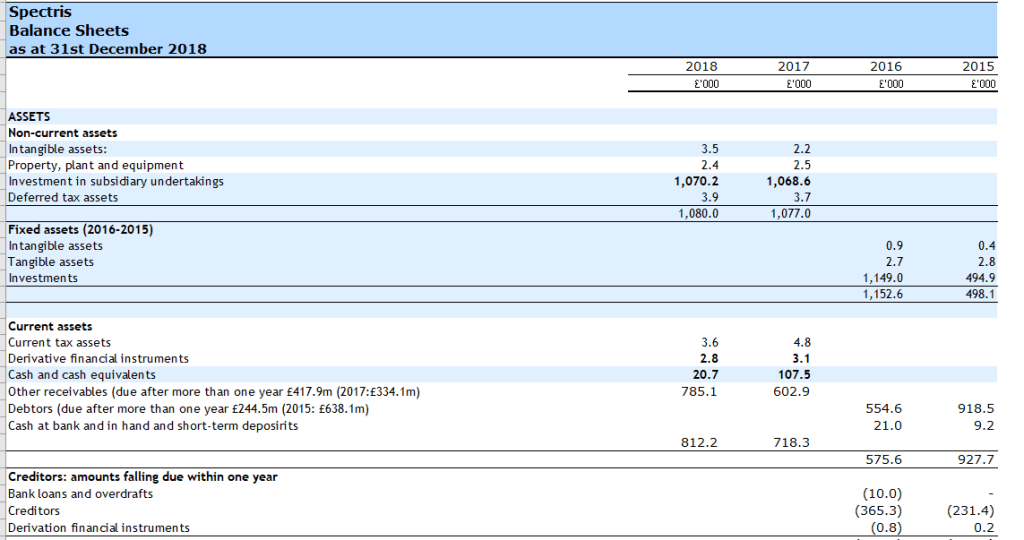
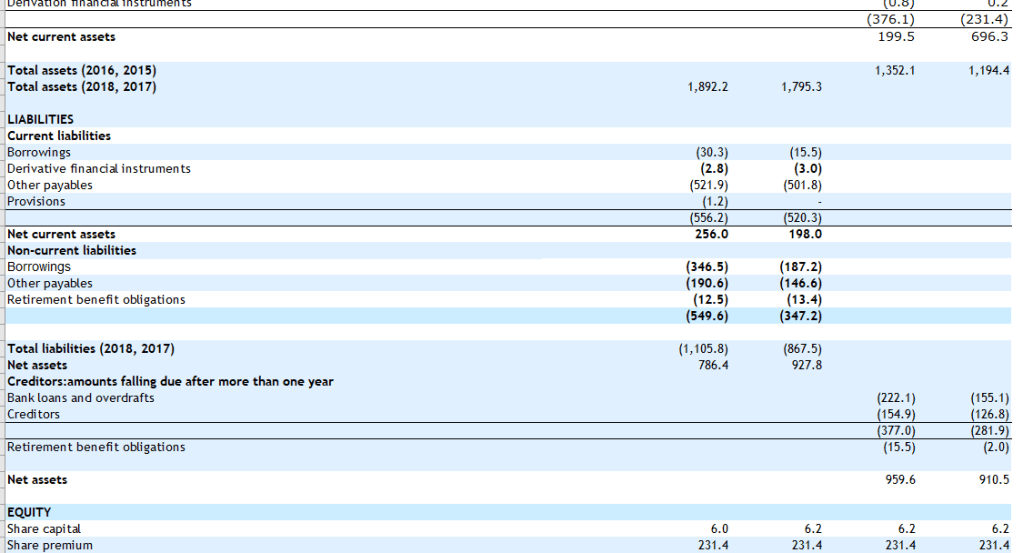

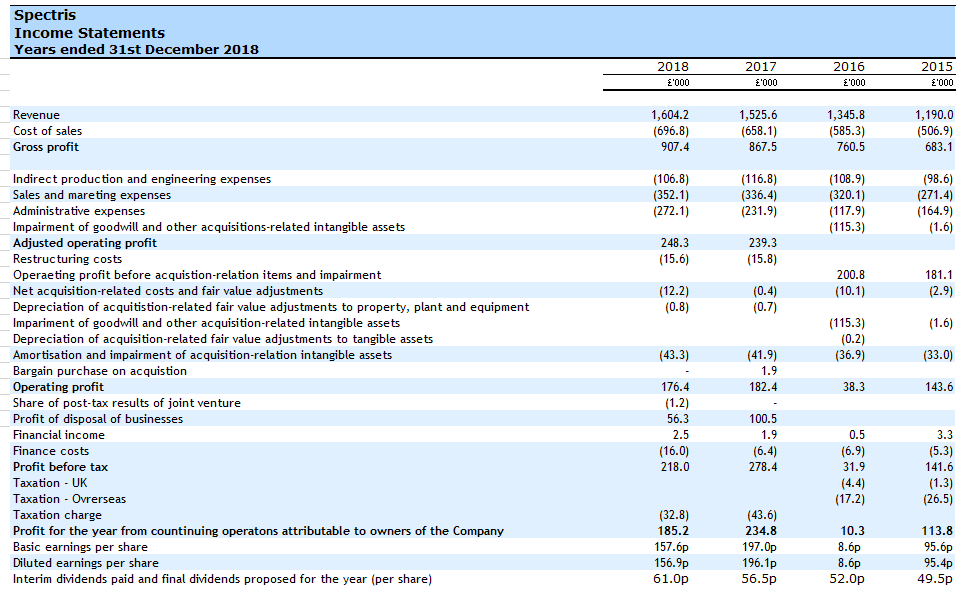
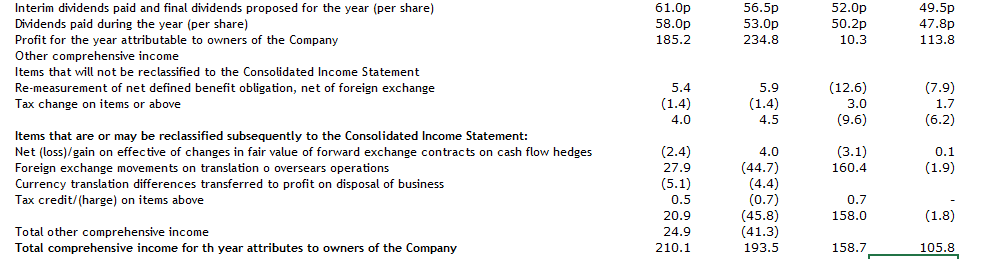
As I was reading through the introduction and Chapter 1 of the study guide, my first thought was “what have I gotten myself into”. There seemed to be so much we had to do already, and it was only day 1 week 1! As I work full time at CQUniveristy in the Student Advice team, I spent the whole couple of weeks leading up to Term 3 advising students to get familiar with moodle, sportal, and what their unit content had be, little did I should have been checking into my studies PRIOR to the first week. This is the first unit I have been involved in where it is recommended to start 2 weeks before Week 1. I am fearing for the students who have not yet enrolled in their Term 3 unit. I felt very overwhelmed going into this unit and reading all the work and reading that had to be done. I am also nervous to learn accounting as I believe I won’t understand it and have heard it is boring, however, believe it will be useful.
Making my way through the introduction, it is comforting to know that the teaching staff are on our side and here to help. Martin and Maria use helpful tips and tricks to help us succeed in this unit. Even though I do feel very overwhelmed with everything that needs to be completed, it is helpful to have tips to refer to when in doubt with what to complete and how to complete it. Moodle is also laid out to easily read and access, however, I can get quite overwhelming and feels like you have a hundred things to do before week 1. I found it is easier when you take your time to read through moodle and also refer to the check list supplied.
Through the introduction, I felt I could relate to the quote “Don’t say you don’t have enough time. You have exactly the same number of hours per day that were given to Helen Keller, Pasteur, Michelangelo, Mother Teresa, Leonardo da Vinci, Thomas Jefferson, and Albert Einstein.” H. Jackson Brown Jr. I found this interesting and will find this useful for future studies.
I am feeling nervous to create and post on the blog through WordPress. As I have little to no experience with blogging, I will find this task challenging, especially ensuring the layout is what I am wanting as I am not very artistic. I do however, like to write short stories so this may come in handy when trying to write blog posts. I am also nervous to share the blog as I can be quite intimidating sharing the draft pieces of your work for people to criticise However, it will be useful to have feedback before submitting. I am also slightly anxious with what I will be submitting on Peerwise. What if I don’t have any high-quality questions to ask? Or have the right answers? At first, I was not sure of the point of both the blog and Peerwise but after reading through, I can now see the it is to enhance online communication skills and interactions with others and learn how to use other flatforms. Additionally, seek answers and assistance from peers within the unit.
From the introduction and chapter 1, I have already learnt there is much more to accounting than just record keeping. As I was reading my way through chapter 1, I became confused and worried that I would not be able to get my head around it. However, Maria and Martin discussing and explaining accounting, carried the belief that that it can be broken down to understand it better. I was reminding myself to look for answers on what exactly is accounting and what does it involve. It will be interesting to learn how the changing world of online communication has also affected accounting including accounting software and specifically all the software’s that are available for business’s became quite confusing. How would you know what to pick? What is the best one? Are they all the same?
It seems as if learning accounting foundations is essential for a successfully business. I am finding this study interesting but am definitely wanting to get my head around the concepts more, including what accounting really is and what it involves.
Exchanging values. I found this slightly confusing, how would this work? Would it rely solely on trust?
Trusts. I had to read this paragraph a few times for it to sink in, but I found this interesting that there are so many aspects to a business, and accounting in a solid foundation.
I find it interesting that all companies around the world use international accounting standards, and go by the same ‘rules’. Again, reading through chapter 1, it is clear understanding accounting fundamentals can really enhance business operations. I can now see the importance of accounting record keeping to understanding the operations of the business and am excited to learn how to put these records down on the spreadsheet for our own company. It will be interesting researching the business and seeing the business realities after recording the numbers.
Double-entry bookkeeping. I am enjoying reading how accounting has adapted over the years and found it especially interesting that Luca Paciolis systems that he published still include most of the aspects of accounting today. It will be thoroughly interesting to read how accounting has adapted, especially with globalisation and technology. At first, I did not understand why records needed to be entered twice, but then found understanding after reading further into chapter 1, including propriertorship. I found it slightly confusing at first to why the owner is legally separate from the firm itself and its activities. I also found it interesting how much trust is needed for double entry accounting between the firm, its owners and the bank and found it confronting how easily and quickly it could change, simply by losing that trust or obligation.
Reading through journals and ledgers – trying to understand and memorise this concept as it seems that it is fundamental to understand. I did need to read the chapters again to really understand the difference between a journal and a ledger but have concluded that financial records are entered into a firms accounts based on key ideas and concepts (jounrals and ledgers) which influences the way we view transactions.
Debits and credits. I found it interesting that debits were on the left-hand side and credits on the right-hand side. Why is this? And how did it turn into meaning increasing or decreasing of the account. I did find this section of chapter 1 confusing, including equity and liability. Reading further down in chapter 1 including the paragraph of measure of value, I found confirmation and realisation that assets, liabilities and equity are the three elements that provide a measure of the value of a firm. I am eager to read more within the study guide to fully understand the full scale of concepts and fundamentals within accounting.
Accounting equation. As I was confused with equality and liabilities, I found this section confusing to try and understand the equation that underpins accounting. I am looking forward to reading more in relation to this and am confident I will grasp this concept in the study guide.
Overall, I did find most of this chapter confusing and difficult to get my head arounds, however, I am confident that making my way through the study guide, watching the lectures and interacting with peers will enhance my knowledge and learning within accounting. I am eager to learn and have a sense of excitement to learn new thing’s but I am nervous for the challenges ahead. I am interested to see how I will learn in this unit especially as through this chapter, I have grasped that there are many forms of learning and it can be quite complex, rather than ‘acquiring further knowledge’. I hope my learning is constructive and meaningful throughout this unit and I develop further understanding throughout unit.
At first accounting did not make sense to me but have realised there are many aspects to it which I am eager to understand and enhance my learning, including understanding the ideas of accounting as ‘Ideas are powerful’. I am confident in the idea that accounting records and measures the economic and business realities of a firm which influences the view on the business.
ASS#1 Step 2
Questions / KCQ’s – Chapter 2 and 3.1 – 3.2 Reflection
I have started this unit with an open mind, however, consciously knowing I will struggle with this unit as I do not understand accounting and felt very overwhelmed with how much there is to do. I am reading through chapter 2, my first thought is how can accounting be a game? Is there really more to it than recording numbers and finances? My understanding of accounting is the recordings of financial transactions of a business. It is interesting thinking of it as a ‘game to be played’, especially having to learn the ‘rules of the game’.
As I am reading through Chapter 2, I can see that it is focussing on the regulations imposed on firms in Australia when they provide financial information generally to people outside of firms, especially different investors, owners and equity owners. It is also considering the accounting concepts in relation to Financial Statements.
I did take away some useful information, which going into reading the chapter, could not understand what ‘rules of the game’ would apply to. The game is to use a firms financial statements to better understand a firms economic and business realities and understanding the rules of the game assists with making sense of the accounts provided by managers to parties outside the firm, especially equity investors – make this your closing statement
It is interesting that at first, a firms financial statement was only for the firms itself eyes to see. I suppose they did eventually have to provide some sort of document to customers or investors outside the firm, at any point in time. To be honest, it did not surprise me that banks had something to do with the rise in the need to supply financial documents. After all, mostly everyone’s money is with a bank. In relation to firms and business’s, banks need to investigate and analyse their finances before approving loans or extend credit etc.
At first, I was confused with the separation of management of firms from the equity of ownership. Then from some research, I learned this meant the separation of the management from the right to have beneficial interest in a company’s assets. But what extent would that go to?
Equity = the values of shares issued by a company
There was sections throughout the chapter that surprised me. I did not think that ‘financial accounting’ referred to providing accounting information to people outside a firm. I assumed this was just another form of accounting and found this concept interesting. I also did not think that firms only had one set of accounting information. Accounting at first seems to be really complicated and has a lot of rules and regulations, however, can be simplified by remembering there is only one set of accounting for all firms. It took me back on how little I know about accounting. I am hoping by the end of this unit, I have a better idea and grasped some concepts of accounting.
I was happily surprised how quickly I understood what GAAP meant, however, found it confusing that its purpose is to be generally only used for following the rules of creating financial statements for parties outside the firm, but some accountants use it within a firm and follow the same rules as it is convenient. How could anyone remember these rules? Basically, my understanding is it is used to make judgements and compare financial data within a firm. This concept can be quite confusing when you think about the multiple number of rules that apply to accounting and how much they change. It was actually interesting to know now all Businesses are required to produce financial statements that are conformed by GAAP. My first initial thought was how does the government determine who does and doesn’t have to report? As I read my way through, it was understood that only companies that need to actually issue general-purpose financial statements need to comply with the accounting rules. But this then lead to why don’t all businesses need to produce this document? I found this concept quite confusing. My understanding of this concept is that general-purpose financial statements are only issued by companies that have outside parties to consider. In thinking this, I guess it would be hard for small businesses to comply with these GAAP standards as they may seem irrelevant. I also found some useful information here: https://www.cancapital.com/resources/should-small-businesses-worry-about-gaap-new-private-company-proposals/
When thinking about the Accounting Standards set by the Australian Accounting Standards Board (AASB) and the International impact some countries and their own reporting standards have on Australia, my first thought is how does this affect Australian Businesses? How hard would it be to stick to and obliged to these standards? I did some more research into what the standards actually entail on the Australian Government website, and found some useful information here: https://www.aasb.gov.au/Pronouncements/Current-standards.aspx. These standards and this concept can be quite confusing and ery complicated. Especially taking into account that it can change and a lot of businesses are relying on this to assist with preparing and recording financial documents and data, and that’s not even bringing the legislation side of things into it! This concept can be confusing if you have no idea about legislation and how it works. I did study law in school and did some units in university involving law, so I did find this helpful to grasp the idea of all different kinds of legislation that would come into account.
I found the concept of reporting an entity quite confusing. What is an entity? I needed to read over the first paragraph a few times for it to sink in. I am quickly understanding that there are many things that businesses need to take into account in terms of how they record all financial activities. I can understand though, that firms are required to prepare and issue general-purpose financial statements and comply with these rules if they are reporting entities. After reading through section, I quickly came to realise that an entity refers to the types of users that require the general-purpose financial statements from a firm so they can allocate to their own resources. I was a bit taken back from this concept. Why do businesses need to report entity’s and what they do with the statements? However, I quickly realised that a firm NEEDS to report an entity, so they are aware of who needs as general-purpose financial statement and how they will comply with all the accounting ‘rules’.
You know accounting is confusing when there literally cannot be a written rule for most things. This made me reflect on how even more confusing it may be to the members of a firm who actually are producing the financial statements and gathering all the appropriate information, while complying with the rules. While reading though this chapter, it is evident that having knowledge in accounting builds up over time and we learn for understanding and developing everyday. It is clear, accounting does not have clear cut rules
Have learnt through reading this study guide how important it is to connect to peers to acquire further knowledge and bring our own experience. I haven’t been posting as much on Peerwise etc but will definitely try to make more of an effort. Interacting with peers within the unit is definitely not something I am not use and it has changed how I am learning, which will be very beneficial
It is interesting to read how a firm’s financial statement can set out to view the economic and business realities of a firm for people within the firm, but what about people outside the firm? As the AASB provide the AASB F Framework for the Preparation and Presentation of Financial Statements framework to guide its development of accounting standards, does this help outsiders of a firm also? Especially if they are always changing. However, I can see how it would be useful for accountants to refer to this framework to prepare documents. It is confusing to me how businesses outside of Australia can affect the accounting standards, I initially would think Australia had different ‘rules’ to go and not take International interest.
One section I found I could understand was accrual accounting. This concept came easy to me, especially when you refer to paying your phone, water or electrical bill… you receive the service, then pay for it later. I was a bit confused how this would affect financial statements, but I myself have not had much to do with them, however, soon realised after further reading that accrual accounting matters when looking at the economic side of a business, in relation to its financial position. It was interesting to read that accrual accounting is used for financial statements I found this concept easier to grasp than others as it was easier for me to understand.
I concept of materiality accounting did confuse me. I was attempting to think of the idea as something that can affect the economic decisions of the financial statement including negatively, positively or particularly adversely and can be of different qualities of information. It is evident that while preparing financial statements, management need to be prepared to make several judgements when producing the document.
Chapter 3.1 and 3.2 (still currently working to finish this section)
I was hesitant and worried to read chapter 3 regarding the financial statements as I was expecting it to be confusing and felt a bit overwhelmed. While reading through the introduction, I attempted to grasped the concept of getting to know the ideas and concepts about financial statements to fully understand what they mean.
My company is SPECTRIS.

After viewing company site –
After receiving my company, I hoped straight on google to find out some more information on the company, as I had never heard of it before. After reviewing the companies webpage, in short, Spectris is a supplier of product-enhancing instrumentation and controls, an electrical equipment supplier in the UK.
After reading through Spectris website and reviewing the annual reports for the last 3 years, I came to the conclusion that Spectris operations and activities mainly include providing high-quality instruments, expertise and associated software to specific technically-demanding industrial applications. Their main goal is to improve customer satisfaction by enhancing customer productivity and assisting with work better, faster and more efficiently by outlining clear benefits. This is highlighted throughout the annual reports.
Background information on Spectris
Having difficulty with understanding?
Areas that seen crucial or important?
Key challenges? How are they meeting challenges?
Meeting KPI’s – It was noted throughout all the annual reports that management continuously put performance measures in place to better assess the underlying trading performance of the business
From strategic renew:
Successful?
Reading through the annual reports, it is obvious that they have been successful over the years as they have evolved and acquired a number of business’s and suppliers
Their strategy:
Providing high-quality instruments and expertise and focus on specific high-growth markets. Basically – The provision of technology-enabled solutions, based on high-qulaity instruments, application capability, domain expertise and associated softward and service offerings is the core of the strategy.
STUDIOSITY
I have never used Studiosity being a student, but am often encouraging other students in my current role at CQU to use this service. After using it and submitting my draft for the reflection on chapter 2, 3.1 and 3.2, I definitely think it is a great service for students. I submitted the draft on Wednesday night and the feedback had come back that night. Fantastic turn-around time! I received feedback that my draft was well-structured and that my body paragraphs are focussed and often introduce effective topic sentences. I also received some constructive criticism including to try not use contractions with my words. For example, use ‘They are’ instead of ‘They’re’. They also suggested checking for prepositions within my text and ‘run-on sentences’, which occurs when you combine two sentences. Using this service definitely provided me with confidence moving forward with my writing and I will definitely use Studiosity in the future.
Welcome to my blog!
My name is Claire T and this is my blog. I have been studying at CQUniversity since 2016 (have changed courses a few times) but I am now working towards my Diploma in Business and Bachelor of Business majoring in Management and electives.
Within this blog for ACCT11059, I hope to publish my drafts for the required assessments and hope to receive constructive feedback. Please bare with me as I am new to blogging and have little to no experience with editing a blog let alone writing content, although do enjoy writing short stories 🙂
One of the wonderful things about blogs is how they constantly evolve as we learn, grow, and interact with one another. I look forward to viewing other peoples blogs!
Have a WordPress.com account? Log in now.

