Step 7
Going into step 7, I was quite nervous, as I knew it would be difficult to choose some products that Spectris sell as it is so broad and they do offer multiple services around the world. Their products fall under different business segments including Materials Analysis, Test and Measurement, In-line instrumentation and industrial controls. They do also have several operating companies including Brüel & Kjær Vibro, BTG, NDC Technologies, ESG Solutions, HBM, Millbrook, VI-grade, Omega Engineering, Malverm Panalytical, Particle Measuring systems, Concept Life Scienes, Red Lion controls and Servomex which they manufacture, produce and sell products to consumers. These companies fall under the different business segments. As the there is so many products that Spectris can supply within different segments, I conducted further research and decided to base the products of case studies from products that Spectris has previously supplied from their operating businesses as it was easier to determine the products Spectris would sell. I was not so confident with trying to determine the cost of each of the products as I had never associated with them and I also could not locate any pricing information on the Spectris home page or form any reports so I know I will really have to guess the pricing of the products. I was also nervous about determining the variable costs and contribution costs. After I estimate the selling price and variable costs, I will be able to determine the Contribution Margin. I also found it helpful to refer to the Spectris Corporate spreadsheet – https://www.spectris.com/~/media/Files/S/Spectris/documents/signpost-docs/spectris-factsheet-march-2019.pdf.
First product from Spectris:
The first product falls under the Test and Measurement segment that Brüel & Kjær Vibro completed. Link to case study – https://www.spectris.com/about-us/case-studies
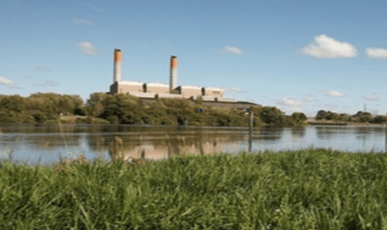
I really had no idea how much a VC-8000 STEPOINT system would cost. I had never heard of this system before and didn’t really know what it would entail. Based on reading the case study, I can see understand that the system provides both protection and condition monitoring of the generating units for the 250 gas-goal fired steam turbine. This system is using for continuous machine monitoring to fit specific needs. I have decided to base my figures off the Spectris Corporate spreadsheet. The sales within the Test and Measurement were a total of £522.6m. I’m going to estimate that to purchase the VC-8000 STEPOINT system it will be roughly $20 000 as I can imagine. I am going to estimate the variable costings to be 30% of the sale price, totalling $6000. I did again refer to the Spectris Corporate spreadsheet for this. This variable costing would include labour costs and equipment needed to construct the system.
Contribution Margin = Sales – Variable Costs
Sales 20 000 – Variable 6000
Contribution amount = 14 000
Second product from Spectris:
The second product I received from this case study – https://www.spectris.com/about-us/case-studies which falls under the segment of Industrial Controls.
Spectris’s operating business Omega Engineering created a temperature monitoring system that also includes data automation that makes food safety compliance more effective. They constructed this system for the Food Innovation Centre at Rutgers University (FIC). FIC is a unique food business incubator and accelerator. They work to ensure food safety training amongst organisations and have a compliance and inspection process, thus needing gold standard of food safety constantly. Omega Engineering took that opportunity to enhance FIC monitoring solution and created a system that did more than just ‘monitor food temperature’. This system was designed to develop an automated wireless temperature monitoring and data analytics solution for FIC, which also includes receiving alerts when areas are falling under the correct temperature.
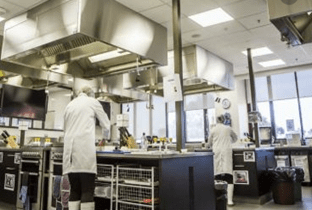
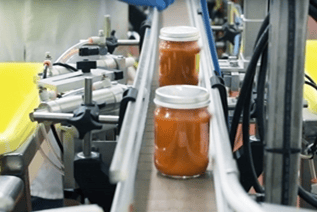
Again, I was not sure what this system would cost. General small food temperature monitoring equipment for a domestic household could range anywhere from $20 – $200 so I am definitely going to estimate this system, being so large and would take a lot of time, energy and resources, would be roughly $40 000 to implement. I am going to estimate the variable costs will be roughly 35% as it would take a lot of labour time to construct the system and all equipment involved. Variable cost would work out to be $14 000.
Contribution Margin = Sales – Variable Costs
Sales 40 000 – Variable 14 000
Contribution amount = 26 000
Third product from Spectris:
The third product is from case study https://www.spectris.com/about-us/case-studies which also falls under the Industrial Controls segment.
One of Spectris operating companies Red Lion Controls assisted to improve communication across four pump stations along an 11-mile pipeline, including four pump station RTU cabinets that sit along the pipeline, to deliver water to a treatment facility for Quantum. Quantum needed to leverage and improve the existing infrastructure while infusing modern technology. Red Lion Controls implemented a product that measures, monitors, controls and informs the product during the production process.
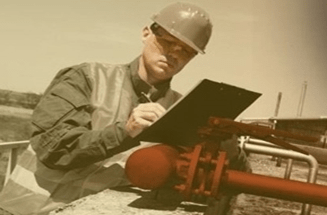
As the 11-mile pipeline is quite large, I can imagine it would have been costly for Quantum to implement Red Lion Controls new communication network. I am going to estimate the selling cost of this system would be around $1500 each as it is a 4G LTE cellular RTU and GPS control system. After further research, Red Lion’s RAM 600 celluar RTU’s feature up to five Ethernet ports and a RS-232 serial port. It also features a web-based engine that can trigger built in or send SMS text messages based on real-time operational data and can process in extreme conditions. I am going to estimate the variable costing would be roughly $400 including labour time for someone to construct this system and equipment.
Contribution Margin = Sales – Variable Costs
Sales 1500 – Variable 400
Contribution amount = 1100
What is the Contribution Margin telling us?
The contribution margin from the VC-8000 STEPOINT system, temperature monitoring system and RAM 600 cellular RTU was $14 000, $26 000 and $1100. The contribution margin traditionally tells us how much of the revenue will be available after the variable expenses are covered, for fixed expenses and then if any is left, it would (hopefully) go into the profit.
The variable costs would include labour, equipment for the systems and products being processed. However, the fixed costs for Spectris and their operating businesses (Brüel & Kjær Vibro, BTG, NDC Technologies, ESG Solutions, HBM, Millbrook, VI-grade, Omega Engineering, Malverm Panalytical, Particle Measuring systems, Concept Life Sciences, Red Lion controls and Servomex) could include electricity, rates, wages for staff etc.
As all Spectris contribution margins are above zero, they will all contribute to the profit of the organisations.
Constraints on Spectris
After reviewing reports and annual statistics, Spectris definitely seems like they are a competitive business and have quite a large volume of customers within each different segment. However, Spectris would also face some constraints. It is not uncommon that firms would face constraints. Constraints can alter or affect their decisions for the firm including products or services they offer.
As Spectris deliver its services from different operating businesses, (Brüel & Kjær Vibro, BTG, NDC Technologies, ESG Solutions, HBM, Millbrook, VI-grade, Omega Engineering, Malverm Panalytical, Particle Measuring systems, Concept Life Sciences, Red Lion controls and Servomex) and again in different segments, this offers the great possibility they will be faced with several constraints from each segment or operating business. These constraints could include competition from other suppliers, staffing issues and things such as supply shortages. Supply shortages could hold back overall sales growth. There is also the risk of potential product refreshers from Operating Businesses as they would go through different stages of products, and some may need updating. Spectris would have to take into consideration these possible constraints when making decisions. To combat these constraints, Spectris does a strategic review to assess each of the operating companies to determine their value creation potential and determine key attributes that are required to be a platform business.
Step 8
Please find Ratios spreadsheet attached with submission.
I was quite anxious going into step 8 as I was hoping I could complete the linking correctly and understand what the ratios were telling me. I am excited to learn more about my company through the financials.
Trying to calculate the share price was difficult to locate on my financial statements as there was a lot of figures. I ended up needing to control F and find the closing share price as putting “Share price” came up with a lot of results. I had to search this closing share price within each financial statement as they did not show in each other’s that I could locate. My understanding of the ‘Share Price’ is the dollar amount that investors want and are willing to pay for one share of the company’s stock and products. I was very interested in this ratio as I feel like so far Spectris do really well with their figures. Once I calculated the share price, I was happy to see the trend had become positive. In 2015, the amount that investors were wanting to invest which by 2018, it turned to 6 million – finish this
With the ordinary share price, I found this easy to locate on the financial spreadsheet. Once I calculated the share price, I was happy to see the trend had became positive. In 2015, the amount was 0.6 million which by 2018, it turned to 6 million.
Profitability Ratios
Profit margin = Profit after income tax (NPAT)/ sales. Within the profit margin ratio, my understanding is that it compares sales and demonstrates how well the company is actually doing and how much is returning into net profit. So, we would want to see it as a higher ratio, as the higher it is, the more profit is going into the company. What return are we gaining? After looking at Spectris Net Profit Margin ratio, I am very happy with the figures. From 2015, the net profit was 8.9% and began to get higher over the years. In 2018, the ratio was 13.7% which is a great improvement from 2015.
It is my understanding that Return on Assets (ROA) is an indicator of how efficient the company is at using its assets to actually generate the earnings. I can imagine that the higher the ratio, the better as this would mean the company was successfully handling the assets. Comparing Spectris ROA ratio, there is improvements from 2015 – 2018 by quite a lot. In 2015, the ratio was 7.3% which climbed to 10% in 2018. This means that in 2018, Spectris received 10% of the total assets back and earned $0.10 for every $1 it has in assets.
Efficiency Ratios
My understanding of the days of inventory is it is how long it is taking the company to sell the products. I found this section challenging and it was hard to determine what to select as the ‘daily cost of goods sold’. Looking at Spectris days of inventory, it was interesting that in 2015, the days totalled 131.41 and as the years went on, it improved drastically in 2017 with 97.61 to then spike again in2018 with 133.36 days. In my opinion, this is not a positive result as it is showing that from the time the product is produced, it stays in inventory for that period of time. However, if we assume Spectris maintains a constant quantity in its inventory, which is seems to by looking at the figures, there may be economic or competitive factors that are causing the high inventory days. I did a quick research and there are several high competitors with Spectris including Bruker, which has had funding go into the company with a total revenue of $3.9 billion, or Shimadzu with a revenue of $3.5 billion. This would definitely impact the sales that Spectris is producing, although still being quite competitive.
My understanding of total asset turnover ratio is it helps us to identify how efficient the company are using their assets and the sales created from the assets. Looking at Spectris total asset turnover ratio, it has not done very well as it is all averaging about 1-cent. I believe a good turnover ratio should be around 4 -6 from research and speaking with other students, as this usually means the rate which companies restock items is balanced.
Liquidity Ratios
Looking at the current ratio, it is my understanding that you are analysing and comparing the company’s current assets to its current liabilities and how well they pay for the current liabilities or short term obligations. For Spectris, the % has shifted from 2015 to 2018. In 2015, the current ratio is 2.96 and in 2018 it is 2.43. The current ratio for Spectris is telling us that they were able to pay their debts and short-term obligations. The higher the ratio, the more capable a company is to paying its obligations so although it did go down from 2015, I was quite happy to see Spectris Liquidity ratio was more than 1. These records indicate that Spectris is in good financial health. Although, because it didn’t really change from 2017 to 2018, this may mean that there was a weakness in the current ratio which includes the difficulty of comparing and measuring all the operating businesses or lack of trending information.
Financial Structure Ratios
My understanding of the Equity ratio is it is funded by shareholders and determines the portion of assets that are funded by debt or equity. Looking at Spectris 2018 figure, it was 58.9%, so for every dollar of assets that was funded by the equity investors, only roughly 58.9c was invested.
In relation to the Debt/ equity ratio, it is my understanding that this will show that for every dollar the equity investor is investing, how much is the bank or another contribution company actually is putting in to fund the business. In 2018, this was 69.8% which I believe is quite high, as this may show investors how much debt Spectris is in. It has increased from 2015. With only 51.0% and even 2017, which was only 49.4%.
Market Ratios
When I calculated the dividends per share it was quite large which made me question if I did it correctly. Listening to Maria’s video on Ratios, the dividends are meant to be low, as this is the amount paid out in dividends to shareholders and investors. Although as per the study guide chapter 4, dividends can be affected by a firm’s dividend policy, which then ultimately affects what is being transferred. After referring to the financial statement for 2018, Spectris proposed to pay a dividend of 40.5 pence ($0.78 Australian money), combined with the interim dividend of 20.5 pence ($0.39 Australian money), gives a total dividend of 61.0 pence ($1.17) per share. I am still not sure how the total dividends I have calculated within the ratios came to such a high number. It may be impacted from future investment needs.
The basic earnings per share is the difference between diluted (what if), earnings per share is what is based on profit. Comparing Spectris figures, I am pleased with the higher earnings however, was significantly reduced from 2015, $176.33 to 2018, $35.02. This is telling us Spectris’ profitability from its profit and shares. It is my understanding this is calculated to determine, for every share, how much have we earned. It is the total profit, spread across total number of shares and what they could have paid out to the company. This would need to be a larger figure as companies would rather retain earnings than provide to shares
My understanding of Price Earnings Ratio is the measurement of inflation of a shares and how long it will take to pay back with investment. I was a bit concerned when I saw Spectris figures at 0.07 for 2018 and even less in 2016 and 2015 at 0.01. My understanding is economic conditions can influence the Price Earnings ratio as they affect the financial market. Another reason why this figure may be so low, is the company may have increased its debt. This is a bit confusing as with the liquidity ratio, we can see Spectris is very successful with paying off the debt.
Ratios based on reformulated Financial Statements
The difference with this section of ratios is we have separated the operating and financial assets. I was really happy with the return on equity ratio as the trend is going in a positive direction from 2015 at 10.95% to 2018 of 17.04%. This tells me that Spectris are able to generate profits from its shareholders and investors of the company.
In relation to the Return on Net operating Assets I compared to RNOA under return on assets within Probability and trend is similar but when we separate the financing items, the return gets better and gives better identification on how Spectris is using their operational assets.
For the net borrowing costs, I can understand that we would be comparing this like an interest rate on loan. Spectris figures and percentages tell me good source of financing in the last two years as it is decreasing the cost of the loans from 2017 to 2018.
When I calculated the profit margin figure and compared it to the margin above I can understand that for every dollar of sales we are turning 13.1c (as per 2018) into operating income. I can see the trend is starting to increase and there not much difference with the profit margin in profitability ratios, in fact they are almost identical. The net profit margin is also telling me that most of the income is to do with operating activities.
My understanding of the total asset turnover is calculating how many times are we are turning over the dollar value of our assets into sales. I can imagine we would want to see a bigger figure and see that it is increasing. In relation to the Asset turnover, when I calculated the figure I compared to Total Asset Turnover in the Efficiency ratio. I noticed that the trends are similar but both slightly decreasing. This may mean that Spectris may not be utilising their assets to actually generate the sales. The turnover has improved when separating the finances out from the rations based on reformulated Financial Statements.
Economic profit
My understanding of Economic Profit is it calculates the total revenue received and also implies the costs for a firm. It is to measure the earnings of the firm. To work out the Economic profit, we can look at the main drivers which is Return on net operating assets (RNOA). RNOA is the Operating income after tax (OI) divided by the Net operating assets (NOA). For the weighted average cost of capital (WACC) I decided to use 11% as when I was searching the financial statements for Spectris from 2015 to 2018 it remained 11%. I was reluctant to use this percentage for WACC as the recommended figure from the assessment instructions was 10%. However, I decided to stick with what was on the financial statements as this also wouldn’t change much from 10% to 11% I imagine.
In 2018, the economic profit was $46.77, in 2017 it was $52.83, in 2016 it was $20.76 and in 2015 it was -$16.69. I was happy that most of the totals were positives. Spectris is trying to produce their goods to maximise the profit and the totals pf economic profit meant that the profit is a greater return than the WAAC. In 2015, as the profit did not go over the WACC which resulted in a negative economic profit. I was surprised considering how well Spectris did with its closing balance’s within the Statements of Movement in Equity, and the total of assets and liabilities. It had quite a large number of total operating assets and liabilities in 2015 through to 2018 including the NOA of $1584.20 in 2018. A firm’s normal profit is revenue, including explicit and hidden expenses, whereas the economic profit is the difference between the revenue received from the sale of an output and the cost of all the inputs used. From reading the study guide, it is my understanding that the economic profit is the ‘what if’ analysis for production levels. I believe the economic profit may have may resulted in a negative in 2015 from the hidden costs such as equipment, labour or production costs from the different operating business that weren’t taken into account. They may not have been taken into consideration in relation to the financial statement and accountants may not have included it.
Step 9
I actually really enjoyed completing this section of the assessment. I found it really interesting to put these figures in excel and work out the payback period for the two options.
Spectris is wanting to identify a group of potential operating businesses to expand the work capital and deliver greater value to a wider group of clients. To do this, they are considering investing in two operating businesses. The first option is Instrument Solutions and the second option of investment is Ergon Energy. Currently Spectris has several operating businesses that operate and supply award-winning productivity-enhancing instrumentation and control systems and products to a wide variety of customers globally. There is now an opportunity for Sprectris to expand its operating businesses and invest to gain further economic growth.
As there are several other businesses and investors that Instrument Solutions and Ergon Energy may have, it is suggested that each of these products be given the length of 10 years. Managers need to decide and make decisions that will affect the business long-term and it is a goal for making long-term capital investments These two choices of investment are expected to provide benefit in many years in the future. Spectris’s aim is sales growth and to become a more focussed and simplified business, which is highlighted several times in their financial statements. The cash flows generated by both of these businesses would ensure profit is going back into equipment and resources for the systems, technically demanding industrial applications and products that Spectris and its operating businesses use each year. It will also contribute to staff wages and marketing of Spectris. While choosing the right investment we have to consider, would this investment create us value for long-term decisions? As once you commit to these long-term investments, it is not easy to reverse or go back on the investment decision. There is the benefit of both options being an Independent project meaning the cash flow of one investment are unaffected by the acceptance of the other investment.
The investment will begin on January 1, 2021 and the estimated future cash flows are expected to be received on 31 December of each year. The estimated cost, the estimated years, residual value and estimate future cash flows of each investment opportunity are set out in the table below. All amounts are express in Australian Dollars AUD. We are going to assume the rate of return/ discount rate/ WACC of 11% as this is the same as I used with my ratio, which was the WACC I found for Spectris within the financial statement. We are going to estimate that Instrumentation control sell products for 2m and Ergon Energy sell products for 3m.
| Instrument Solutions | Ergon Energy | |
| Original Cost | $55 million | $70 million |
| Estimated years | 10 years | 10 years |
| Residual vision | $2 million | $3 million |
| Estimated future cash flows: | ||
| Year 1 – 31 December 2021 | -3 million | – 5 million |
| Year 2 – 31 December 2022 | $10 million | $12 million |
| Year 3 – 31 December 2023 | $15 million | $22 million |
| Year 4 – 31 December 2024 | $20 million | $11 million |
| Year 5 – 31 December 2025 | $25 million | $25 million |
| Year 6 – 31 December 2026 | $11 million | $17 million |
| Year 7 – 31 December 2027 | $16 million | $10 million |
| Year 8 – 31 December 2028 | $21 million | $18 million |
| Year 9 – 31 December 2029 | $7 million | $8 million |
| Year 10 – 31 December 2030 | $13 million | $14 million |
Please find below the Net Present value (NPV), internal rate of return (IRR), and the payback period for each option of investment. Again, the discount rate is 11% and the NPV has been calculated using this rate. The below figures are all displayed in Australian Currency (AUD).
| Instrument Solutions | Ergon Energy | |
| Net Present Value (NPV) | $20.11 | $3.18 |
| Internal Rate of Return (IRR) | 17.6% | 12% |
| Payback period | 4.52 years | 5.29 years |
The Net Present Value (NPV is essentially the difference between the present value of cash flows over a period of time. I have used this formula to analyse the profitability of my two investment options. While calculating the NPV of the each of my options of investment for Sprectris, I was really looking for a positive NPV as this will indicate that the investment would add value to the firm. Having a positive NPV would highlight that the firm will get more back than the cost of the capital. Both Instrumentation Solutions and Ergon energy both has positive NPV, although Instrument Solutions NPV is greater, this gives a more competitive edge.
With the Internal Rate of Return (IRR), we are measuring the investment rate of return. We are using this context savings and loans on the investment and we need it higher than the discounted rate of 11%. Again, the higher the rate the better as we need to ensure the return of the investment will outweigh the actual cost of the investment. If the IRR is negative, there would be no reason to consider the investment option as it would not give a good return. The IRR rate for Instrument Solution is 17.6% where as Ergon Energy was 12%. Although both of these investment options are is higher than discount rate, Instrument Solutions have exceeded the IRR a lot more than Ergon energy, which again, gives Instrumentation Solutions a leading edge.
The payback period refers to how many years it would take for the initial cost of the project/ investment to be earned back to Spectris from the cash flows that were estimated. We need to ensure that the payback period doesn’t exceed the initial estimated years for the investment. If it does, there would be no reason to take the investment. For option 1, Instrument Solutions occurs in approx 4.52 years. The payback period for Ergon Energy is 5.29 years. Again, if Spectris chose option 1, Instrument Solutions, they will receive the initial cost of the investment back earlier.
The main weaknesses I can see with these investment options is that the cash flows are estimations which would clearly really impact all the figures associated with the investments as it is not a true representation of the figures. I can imagine it would be difficult to really understand and know each cash flow. There are also several weaknesses with the NPV, IRR and the Pay back period. The payback period ignores the time value or money and it does not adjust or account for differences in the over all investment, which may impact the time in which the company received the initial cost of investment. This method also does not take into consideration the cash flows after pay back, therefor the company may not have a true representation to determine if the investment will be worth it or not. The weakness associated with NPV is it is very reliant and sensitive to the discount rate, which therefor would be easy to manipulate and change. Any changes in the discount rate would mean big changes to the NPV. In relation to the IRR, the weakness of this method would include potential unrealistic assumptions about the reinvestment of funds.
Going into step 7, I was quite nervous, as I knew it would be difficult to choose some products that Spectris sell as it is so broad and they do offer multiple services around the world. Their products fall under different business segments including Materials Analysis, Test and Measurement, In-line instrumentation and industrial controls. They do also have several operating companies including Brüel & Kjær Vibro, BTG, NDC Technologies, ESG Solutions, HBM, Millbrook, VI-grade, Omega Engineering, Malverm Panalytical, Particle Measuring systems, Concept Life Scienes, Red Lion controls and Servomex which they manufacture, produce and sell products to consumers. These companies fall under the different business segments. As the there is so many products that Spectris can supply within different segments, I conducted further research and decided to base the products of case studies from products that Spectris has previously supplied from their operating businesses as it was easier to determine the products Spectris would sell. I was not so confident with trying to determine the cost of each of the products as I had never associated with them and I also could not locate any pricing information on the Spectris home page or form any reports so I know I will really have to guess the pricing of the products. I was also nervous about determining the variable costs and contribution costs. After I estimate the selling price and variable costs, I will be able to determine the Contribution Margin. I also found it helpful to refer to the Spectris Corporate spreadsheet – https://www.spectris.com/~/media/Files/S/Spectris/documents/signpost-docs/spectris-factsheet-march-2019.pdf.
First product from Spectris:
The first product falls under the Test and Measurement segment that Brüel & Kjær Vibro completed. Link to case study – https://www.spectris.com/about-us/case-studies
I really had no idea how much a VC-8000 STEPOINT system would cost. I had never heard of this system before and didn’t really know what it would entail. Based on reading the case study, I can see understand that the system provides both protection and condition monitoring of the generating units for the 250 gas-goal fired steam turbine. This system is using for continuous machine monitoring to fit specific needs. I have decided to base my figures off the Spectris Corporate spreadsheet. The sales within the Test and Measurement were a total of £522.6m. I’m going to estimate that to purchase the VC-8000 STEPOINT system it will be roughly $20 000 as I can imagine. I am going to estimate the variable costings to be 30% of the sale price, totalling $6000. I did again refer to the Spectris Corporate spreadsheet for this. This variable costing would include labour costs and equipment needed to construct the system.
Contribution Margin = Sales – Variable Costs
Sales 20 000 – Variable 6000
Contribution amount = 14 000
Second product from Spectris:
The second product I received from this case study – https://www.spectris.com/about-us/case-studies which falls under the segment of Industrial Controls.
Spectris’s operating business Omega Engineering created a temperature monitoring system that also includes data automation that makes food safety compliance more effective. They constructed this system for the Food Innovation Centre at Rutgers University (FIC). FIC is a unique food business incubator and accelerator. They work to ensure food safety training amongst organisations and have a compliance and inspection process, thus needing gold standard of food safety constantly. Omega Engineering took that opportunity to enhance FIC monitoring solution and created a system that did more than just ‘monitor food temperature’. This system was designed to develop an automated wireless temperature monitoring and data analytics solution for FIC, which also includes receiving alerts when areas are falling under the correct temperature.
Again, I was not sure what this system would cost. General small food temperature monitoring equipment for a domestic household could range anywhere from $20 – $200 so I am definitely going to estimate this system, being so large and would take a lot of time, energy and resources, would be roughly $40 000 to implement. I am going to estimate the variable costs will be roughly 35% as it would take a lot of labour time to construct the system and all equipment involved. Variable cost would work out to be $14 000.
Contribution Margin = Sales – Variable Costs
Sales 40 000 – Variable 14 000
Contribution amount = 26 000
Third product from Spectris:
The third product is from case study https://www.spectris.com/about-us/case-studies which also falls under the Industrial Controls segment.
One of Spectris operating companies Red Lion Controls assisted to improve communication across four pump stations along an 11-mile pipeline, including four pump station RTU cabinets that sit along the pipeline, to deliver water to a treatment facility for Quantum. Quantum needed to leverage and improve the existing infrastructure while infusing modern technology. Red Lion Controls implemented a product that measures, monitors, controls and informs the product during the production process.
As the 11-mile pipeline is quite large, I can imagine it would have been costly for Quantum to implement Red Lion Controls new communication network. I am going to estimate the selling cost of this system would be around $1500 each as it is a 4G LTE cellular RTU and GPS control system. After further research, Red Lion’s RAM 600 celluar RTU’s feature up to five Ethernet ports and a RS-232 serial port. It also features a web-based engine that can trigger built in or send SMS text messages based on real-time operational data and can process in extreme conditions. I am going to estimate the variable costing would be roughly $400 including labour time for someone to construct this system and equipment.
Contribution Margin = Sales – Variable Costs
Sales 1500 – Variable 400
Contribution amount = 1100
What is the Contribution Margin telling us?
The contribution margin from the VC-8000 STEPOINT system, temperature monitoring system and RAM 600 cellular RTU was $14 000, $26 000 and $1100. The contribution margin traditionally tells us how much of the revenue will be available after the variable expenses are covered, for fixed expenses and then if any is left, it would (hopefully) go into the profit.
The variable costs would include labour, equipment for the systems and products being processed. However, the fixed costs for Spectris and their operating businesses (Brüel & Kjær Vibro, BTG, NDC Technologies, ESG Solutions, HBM, Millbrook, VI-grade, Omega Engineering, Malverm Panalytical, Particle Measuring systems, Concept Life Sciences, Red Lion controls and Servomex) could include electricity, rates, wages for staff etc.
As all Spectris contribution margins are above zero, they will all contribute to the profit of the organisations.
Constraints on Spectris
After reviewing reports and annual statistics, Spectris definitely seems like they are a competitive business and have quite a large volume of customers within each different segment. However, Spectris would also face some constraints. It is not uncommon that firms would face constraints. Constraints can alter or affect their decisions for the firm including products or services they offer.
As Spectris deliver its services from different operating businesses, (Brüel & Kjær Vibro, BTG, NDC Technologies, ESG Solutions, HBM, Millbrook, VI-grade, Omega Engineering, Malverm Panalytical, Particle Measuring systems, Concept Life Sciences, Red Lion controls and Servomex) and again in different segments, this offers the great possibility they will be faced with several constraints from each segment or operating business. These constraints could include competition from other suppliers, staffing issues and things such as supply shortages. Supply shortages could hold back overall sales growth. There is also the risk of potential product refreshers from Operating Businesses as they would go through different stages of products, and some may need updating. Spectris would have to take into consideration these possible constraints when making decisions. To combat these constraints, Spectris does a strategic review to assess each of the operating companies to determine their value creation potential and determine key attributes that are required to be a platform business.
Step 8
Please find Ratios spreadsheet attached with submission.
I was quite anxious going into step 8 as I was hoping I could complete the linking correctly and understand what the ratios were telling me. I am excited to learn more about my company through the financials.
Trying to calculate the share price was difficult to locate on my financial statements as there was a lot of figures. I ended up needing to control F and find the closing share price as putting “Share price” came up with a lot of results. I had to search this closing share price within each financial statement as they did not show in each other’s that I could locate. My understanding of the ‘Share Price’ is the dollar amount that investors want and are willing to pay for one share of the company’s stock and products. I was very interested in this ratio as I feel like so far Spectris do really well with their figures. Once I calculated the share price, I was happy to see the trend had become positive. In 2015, the amount that investors were wanting to invest which by 2018, it turned to 6 million – finish this
With the ordinary share price, I found this easy to locate on the financial spreadsheet. Once I calculated the share price, I was happy to see the trend had became positive. In 2015, the amount was 0.6 million which by 2018, it turned to 6 million.
Profitability Ratios
Profit margin = Profit after income tax (NPAT)/ sales. Within the profit margin ratio, my understanding is that it compares sales and demonstrates how well the company is actually doing and how much is returning into net profit. So, we would want to see it as a higher ratio, as the higher it is, the more profit is going into the company. What return are we gaining? After looking at Spectris Net Profit Margin ratio, I am very happy with the figures. From 2015, the net profit was 8.9% and began to get higher over the years. In 2018, the ratio was 13.7% which is a great improvement from 2015.
It is my understanding that Return on Assets (ROA) is an indicator of how efficient the company is at using its assets to actually generate the earnings. I can imagine that the higher the ratio, the better as this would mean the company was successfully handling the assets. Comparing Spectris ROA ratio, there is improvements from 2015 – 2018 by quite a lot. In 2015, the ratio was 7.3% which climbed to 10% in 2018. This means that in 2018, Spectris received 10% of the total assets back and earned $0.10 for every $1 it has in assets.
Efficiency Ratios
My understanding of the days of inventory is it is how long it is taking the company to sell the products. I found this section challenging and it was hard to determine what to select as the ‘daily cost of goods sold’. Looking at Spectris days of inventory, it was interesting that in 2015, the days totalled 131.41 and as the years went on, it improved drastically in 2017 with 97.61 to then spike again in2018 with 133.36 days. In my opinion, this is not a positive result as it is showing that from the time the product is produced, it stays in inventory for that period of time. However, if we assume Spectris maintains a constant quantity in its inventory, which is seems to by looking at the figures, there may be economic or competitive factors that are causing the high inventory days. I did a quick research and there are several high competitors with Spectris including Bruker, which has had funding go into the company with a total revenue of $3.9 billion, or Shimadzu with a revenue of $3.5 billion. This would definitely impact the sales that Spectris is producing, although still being quite competitive.
My understanding of total asset turnover ratio is it helps us to identify how efficient the company are using their assets and the sales created from the assets. Looking at Spectris total asset turnover ratio, it has not done very well as it is all averaging about 1-cent. I believe a good turnover ratio should be around 4 -6 from research and speaking with other students, as this usually means the rate which companies restock items is balanced.
Liquidity Ratios
Looking at the current ratio, it is my understanding that you are analysing and comparing the company’s current assets to its current liabilities and how well they pay for the current liabilities or short term obligations. For Spectris, the % has shifted from 2015 to 2018. In 2015, the current ratio is 2.96 and in 2018 it is 2.43. The current ratio for Spectris is telling us that they were able to pay their debts and short-term obligations. The higher the ratio, the more capable a company is to paying its obligations so although it did go down from 2015, I was quite happy to see Spectris Liquidity ratio was more than 1. These records indicate that Spectris is in good financial health. Although, because it didn’t really change from 2017 to 2018, this may mean that there was a weakness in the current ratio which includes the difficulty of comparing and measuring all the operating businesses or lack of trending information.
Financial Structure Ratios
My understanding of the Equity ratio is it is funded by shareholders and determines the portion of assets that are funded by debt or equity. Looking at Spectris 2018 figure, it was 58.9%, so for every dollar of assets that was funded by the equity investors, only roughly 58.9c was invested.
In relation to the Debt/ equity ratio, it is my understanding that this will show that for every dollar the equity investor is investing, how much is the bank or another contribution company actually is putting in to fund the business. In 2018, this was 69.8% which I believe is quite high, as this may show investors how much debt Spectris is in. It has increased from 2015. With only 51.0% and even 2017, which was only 49.4%.
Market Ratios
When I calculated the dividends per share it was quite large which made me question if I did it correctly. Listening to Maria’s video on Ratios, the dividends are meant to be low, as this is the amount paid out in dividends to shareholders and investors. Although as per the study guide chapter 4, dividends can be affected by a firm’s dividend policy, which then ultimately affects what is being transferred. After referring to the financial statement for 2018, Spectris proposed to pay a dividend of 40.5 pence ($0.78 Australian money), combined with the interim dividend of 20.5 pence ($0.39 Australian money), gives a total dividend of 61.0 pence ($1.17) per share. I am still not sure how the total dividends I have calculated within the ratios came to such a high number. It may be impacted from future investment needs.
The basic earnings per share is the difference between diluted (what if), earnings per share is what is based on profit. Comparing Spectris figures, I am pleased with the higher earnings however, was significantly reduced from 2015, $176.33 to 2018, $35.02. This is telling us Spectris’ profitability from its profit and shares. It is my understanding this is calculated to determine, for every share, how much have we earned. It is the total profit, spread across total number of shares and what they could have paid out to the company. This would need to be a larger figure as companies would rather retain earnings than provide to shares
My understanding of Price Earnings Ratio is the measurement of inflation of a shares and how long it will take to pay back with investment. I was a bit concerned when I saw Spectris figures at 0.07 for 2018 and even less in 2016 and 2015 at 0.01. My understanding is economic conditions can influence the Price Earnings ratio as they affect the financial market. Another reason why this figure may be so low, is the company may have increased its debt. This is a bit confusing as with the liquidity ratio, we can see Spectris is very successful with paying off the debt.
Ratios based on reformulated Financial Statements
The difference with this section of ratios is we have separated the operating and financial assets. I was really happy with the return on equity ratio as the trend is going in a positive direction from 2015 at 10.95% to 2018 of 17.04%. This tells me that Spectris are able to generate profits from its shareholders and investors of the company.
In relation to the Return on Net operating Assets I compared to RNOA under return on assets within Probability and trend is similar but when we separate the financing items, the return gets better and gives better identification on how Spectris is using their operational assets.
For the net borrowing costs, I can understand that we would be comparing this like an interest rate on loan. Spectris figures and percentages tell me good source of financing in the last two years as it is decreasing the cost of the loans from 2017 to 2018.
When I calculated the profit margin figure and compared it to the margin above I can understand that for every dollar of sales we are turning 13.1c (as per 2018) into operating income. I can see the trend is starting to increase and there not much difference with the profit margin in profitability ratios, in fact they are almost identical. The net profit margin is also telling me that most of the income is to do with operating activities.
My understanding of the total asset turnover is calculating how many times are we are turning over the dollar value of our assets into sales. I can imagine we would want to see a bigger figure and see that it is increasing. In relation to the Asset turnover, when I calculated the figure I compared to Total Asset Turnover in the Efficiency ratio. I noticed that the trends are similar but both slightly decreasing. This may mean that Spectris may not be utilising their assets to actually generate the sales. The turnover has improved when separating the finances out from the rations based on reformulated Financial Statements.
Economic profit
My understanding of Economic Profit is it calculates the total revenue received and also implies the costs for a firm. It is to measure the earnings of the firm. To work out the Economic profit, we can look at the main drivers which is Return on net operating assets (RNOA). RNOA is the Operating income after tax (OI) divided by the Net operating assets (NOA). For the weighted average cost of capital (WACC) I decided to use 11% as when I was searching the financial statements for Spectris from 2015 to 2018 it remained 11%. I was reluctant to use this percentage for WACC as the recommended figure from the assessment instructions was 10%. However, I decided to stick with what was on the financial statements as this also wouldn’t change much from 10% to 11% I imagine.
In 2018, the economic profit was $46.77, in 2017 it was $52.83, in 2016 it was $20.76 and in 2015 it was -$16.69. I was happy that most of the totals were positives. Spectris is trying to produce their goods to maximise the profit and the totals pf economic profit meant that the profit is a greater return than the WAAC. In 2015, as the profit did not go over the WACC which resulted in a negative economic profit. I was surprised considering how well Spectris did with its closing balance’s within the Statements of Movement in Equity, and the total of assets and liabilities. It had quite a large number of total operating assets and liabilities in 2015 through to 2018 including the NOA of $1584.20 in 2018. A firm’s normal profit is revenue, including explicit and hidden expenses, whereas the economic profit is the difference between the revenue received from the sale of an output and the cost of all the inputs used. From reading the study guide, it is my understanding that the economic profit is the ‘what if’ analysis for production levels. I believe the economic profit may have may resulted in a negative in 2015 from the hidden costs such as equipment, labour or production costs from the different operating business that weren’t taken into account. They may not have been taken into consideration in relation to the financial statement and accountants may not have included it.
Step 9
I actually really enjoyed completing this section of the assessment. I found it really interesting to put these figures in excel and work out the payback period for the two options.
Spectris is wanting to identify a group of potential operating businesses to expand the work capital and deliver greater value to a wider group of clients. To do this, they are considering investing in two operating businesses. The first option is Instrument Solutions and the second option of investment is Ergon Energy. Currently Spectris has several operating businesses that operate and supply award-winning productivity-enhancing instrumentation and control systems and products to a wide variety of customers globally. There is now an opportunity for Sprectris to expand its operating businesses and invest to gain further economic growth.
As there are several other businesses and investors that Instrument Solutions and Ergon Energy may have, it is suggested that each of these products be given the length of 10 years. Managers need to decide and make decisions that will affect the business long-term and it is a goal for making long-term capital investments These two choices of investment are expected to provide benefit in many years in the future. Spectris’s aim is sales growth and to become a more focussed and simplified business, which is highlighted several times in their financial statements. The cash flows generated by both of these businesses would ensure profit is going back into equipment and resources for the systems, technically demanding industrial applications and products that Spectris and its operating businesses use each year. It will also contribute to staff wages and marketing of Spectris. While choosing the right investment we have to consider, would this investment create us value for long-term decisions? As once you commit to these long-term investments, it is not easy to reverse or go back on the investment decision. There is the benefit of both options being an Independent project meaning the cash flow of one investment are unaffected by the acceptance of the other investment.
The investment will begin on January 1, 2021 and the estimated future cash flows are expected to be received on 31 December of each year. The estimated cost, the estimated years, residual value and estimate future cash flows of each investment opportunity are set out in the table below. All amounts are express in Australian Dollars AUD. We are going to assume the rate of return/ discount rate/ WACC of 11% as this is the same as I used with my ratio, which was the WACC I found for Spectris within the financial statement. We are going to estimate that Instrumentation control sell products for 2m and Ergon Energy sell products for 3m.
| Instrument Solutions | Ergon Energy | |
| Original Cost | $55 million | $70 million |
| Estimated years | 10 years | 10 years |
| Residual vision | $2 million | $3 million |
| Estimated future cash flows: | ||
| Year 1 – 31 December 2021 | -3 million | – 5 million |
| Year 2 – 31 December 2022 | $10 million | $12 million |
| Year 3 – 31 December 2023 | $15 million | $22 million |
| Year 4 – 31 December 2024 | $20 million | $11 million |
| Year 5 – 31 December 2025 | $25 million | $25 million |
| Year 6 – 31 December 2026 | $11 million | $17 million |
| Year 7 – 31 December 2027 | $16 million | $10 million |
| Year 8 – 31 December 2028 | $21 million | $18 million |
| Year 9 – 31 December 2029 | $7 million | $8 million |
| Year 10 – 31 December 2030 | $13 million | $14 million |
Please find below the Net Present value (NPV), internal rate of return (IRR), and the payback period for each option of investment. Again, the discount rate is 11% and the NPV has been calculated using this rate. The below figures are all displayed in Australian Currency (AUD).
| Instrument Solutions | Ergon Energy | |
| Net Present Value (NPV) | $20.11 | $3.18 |
| Internal Rate of Return (IRR) | 17.6% | 12% |
| Payback period | 4.52 years | 5.29 years |
The Net Present Value (NPV is essentially the difference between the present value of cash flows over a period of time. I have used this formula to analyse the profitability of my two investment options. While calculating the NPV of the each of my options of investment for Sprectris, I was really looking for a positive NPV as this will indicate that the investment would add value to the firm. Having a positive NPV would highlight that the firm will get more back than the cost of the capital. Both Instrumentation Solutions and Ergon energy both has positive NPV, although Instrument Solutions NPV is greater, this gives a more competitive edge.
With the Internal Rate of Return (IRR), we are measuring the investment rate of return. We are using this context savings and loans on the investment and we need it higher than the discounted rate of 11%. Again, the higher the rate the better as we need to ensure the return of the investment will outweigh the actual cost of the investment. If the IRR is negative, there would be no reason to consider the investment option as it would not give a good return. The IRR rate for Instrument Solution is 17.6% where as Ergon Energy was 12%. Although both of these investment options are is higher than discount rate, Instrument Solutions have exceeded the IRR a lot more than Ergon energy, which again, gives Instrumentation Solutions a leading edge.
The payback period refers to how many years it would take for the initial cost of the project/ investment to be earned back to Spectris from the cash flows that were estimated. We need to ensure that the payback period doesn’t exceed the initial estimated years for the investment. If it does, there would be no reason to take the investment. For option 1, Instrument Solutions occurs in approx 4.52 years. The payback period for Ergon Energy is 5.29 years. Again, if Spectris chose option 1, Instrument Solutions, they will receive the initial cost of the investment back earlier.
The main weaknesses I can see with these investment options is that the cash flows are estimations which would clearly really impact all the figures associated with the investments as it is not a true representation of the figures. I can imagine it would be difficult to really understand and know each cash flow. There are also several weaknesses with the NPV, IRR and the Pay back period. The payback period ignores the time value or money and it does not adjust or account for differences in the over all investment, which may impact the time in which the company received the initial cost of investment. This method also does not take into consideration the cash flows after pay back, therefor the company may not have a true representation to determine if the investment will be worth it or not. The weakness associated with NPV is it is very reliant and sensitive to the discount rate, which therefor would be easy to manipulate and change. Any changes in the discount rate would mean big changes to the NPV. In relation to the IRR, the weakness of this method would include potential unrealistic assumptions about the reinvestment of funds.
Based on the figures above, even with the weaknesses, Spectris should chose option 1 of Instrumentation Control as it had the best payback period, NPV and IRR compared to option 2 of Ergon Energy.
Going into step 7, I was quite nervous, as I knew it would be difficult to choose some products that Spectris sell as it is so broad and they do offer multiple services around the world. Their products fall under different business segments including Materials Analysis, Test and Measurement, In-line instrumentation and industrial controls. They do also have several operating companies including Brüel & Kjær Vibro, BTG, NDC Technologies, ESG Solutions, HBM, Millbrook, VI-grade, Omega Engineering, Malverm Panalytical, Particle Measuring systems, Concept Life Scienes, Red Lion controls and Servomex which they manufacture, produce and sell products to consumers. These companies fall under the different business segments. As the there is so many products that Spectris can supply within different segments, I conducted further research and decided to base the products of case studies from products that Spectris has previously supplied from their operating businesses as it was easier to determine the products Spectris would sell. I was not so confident with trying to determine the cost of each of the products as I had never associated with them and I also could not locate any pricing information on the Spectris home page or form any reports so I know I will really have to guess the pricing of the products. I was also nervous about determining the variable costs and contribution costs. After I estimate the selling price and variable costs, I will be able to determine the Contribution Margin. I also found it helpful to refer to the Spectris Corporate spreadsheet – https://www.spectris.com/~/media/Files/S/Spectris/documents/signpost-docs/spectris-factsheet-march-2019.pdf.
First product from Spectris:
The first product falls under the Test and Measurement segment that Brüel & Kjær Vibro completed. Link to case study – https://www.spectris.com/about-us/case-studies
I really had no idea how much a VC-8000 STEPOINT system would cost. I had never heard of this system before and didn’t really know what it would entail. Based on reading the case study, I can see understand that the system provides both protection and condition monitoring of the generating units for the 250 gas-goal fired steam turbine. This system is using for continuous machine monitoring to fit specific needs. I have decided to base my figures off the Spectris Corporate spreadsheet. The sales within the Test and Measurement were a total of £522.6m. I’m going to estimate that to purchase the VC-8000 STEPOINT system it will be roughly $20 000 as I can imagine. I am going to estimate the variable costings to be 30% of the sale price, totalling $6000. I did again refer to the Spectris Corporate spreadsheet for this. This variable costing would include labour costs and equipment needed to construct the system.
Contribution Margin = Sales – Variable Costs
Sales 20 000 – Variable 6000
Contribution amount = 14 000
Second product from Spectris:
The second product I received from this case study – https://www.spectris.com/about-us/case-studies which falls under the segment of Industrial Controls.
Spectris’s operating business Omega Engineering created a temperature monitoring system that also includes data automation that makes food safety compliance more effective. They constructed this system for the Food Innovation Centre at Rutgers University (FIC). FIC is a unique food business incubator and accelerator. They work to ensure food safety training amongst organisations and have a compliance and inspection process, thus needing gold standard of food safety constantly. Omega Engineering took that opportunity to enhance FIC monitoring solution and created a system that did more than just ‘monitor food temperature’. This system was designed to develop an automated wireless temperature monitoring and data analytics solution for FIC, which also includes receiving alerts when areas are falling under the correct temperature.
Again, I was not sure what this system would cost. General small food temperature monitoring equipment for a domestic household could range anywhere from $20 – $200 so I am definitely going to estimate this system, being so large and would take a lot of time, energy and resources, would be roughly $40 000 to implement. I am going to estimate the variable costs will be roughly 35% as it would take a lot of labour time to construct the system and all equipment involved. Variable cost would work out to be $14 000.
Contribution Margin = Sales – Variable Costs
Sales 40 000 – Variable 14 000
Contribution amount = 26 000
Third product from Spectris:
The third product is from case study https://www.spectris.com/about-us/case-studies which also falls under the Industrial Controls segment.
One of Spectris operating companies Red Lion Controls assisted to improve communication across four pump stations along an 11-mile pipeline, including four pump station RTU cabinets that sit along the pipeline, to deliver water to a treatment facility for Quantum. Quantum needed to leverage and improve the existing infrastructure while infusing modern technology. Red Lion Controls implemented a product that measures, monitors, controls and informs the product during the production process.
As the 11-mile pipeline is quite large, I can imagine it would have been costly for Quantum to implement Red Lion Controls new communication network. I am going to estimate the selling cost of this system would be around $1500 each as it is a 4G LTE cellular RTU and GPS control system. After further research, Red Lion’s RAM 600 celluar RTU’s feature up to five Ethernet ports and a RS-232 serial port. It also features a web-based engine that can trigger built in or send SMS text messages based on real-time operational data and can process in extreme conditions. I am going to estimate the variable costing would be roughly $400 including labour time for someone to construct this system and equipment.
Contribution Margin = Sales – Variable Costs
Sales 1500 – Variable 400
Contribution amount = 1100
What is the Contribution Margin telling us?
The contribution margin from the VC-8000 STEPOINT system, temperature monitoring system and RAM 600 cellular RTU was $14 000, $26 000 and $1100. The contribution margin traditionally tells us how much of the revenue will be available after the variable expenses are covered, for fixed expenses and then if any is left, it would (hopefully) go into the profit.
The variable costs would include labour, equipment for the systems and products being processed. However, the fixed costs for Spectris and their operating businesses (Brüel & Kjær Vibro, BTG, NDC Technologies, ESG Solutions, HBM, Millbrook, VI-grade, Omega Engineering, Malverm Panalytical, Particle Measuring systems, Concept Life Sciences, Red Lion controls and Servomex) could include electricity, rates, wages for staff etc.
As all Spectris contribution margins are above zero, they will all contribute to the profit of the organisations.
Constraints on Spectris
After reviewing reports and annual statistics, Spectris definitely seems like they are a competitive business and have quite a large volume of customers within each different segment. However, Spectris would also face some constraints. It is not uncommon that firms would face constraints. Constraints can alter or affect their decisions for the firm including products or services they offer.
As Spectris deliver its services from different operating businesses, (Brüel & Kjær Vibro, BTG, NDC Technologies, ESG Solutions, HBM, Millbrook, VI-grade, Omega Engineering, Malverm Panalytical, Particle Measuring systems, Concept Life Sciences, Red Lion controls and Servomex) and again in different segments, this offers the great possibility they will be faced with several constraints from each segment or operating business. These constraints could include competition from other suppliers, staffing issues and things such as supply shortages. Supply shortages could hold back overall sales growth. There is also the risk of potential product refreshers from Operating Businesses as they would go through different stages of products, and some may need updating. Spectris would have to take into consideration these possible constraints when making decisions. To combat these constraints, Spectris does a strategic review to assess each of the operating companies to determine their value creation potential and determine key attributes that are required to be a platform business.
Step 8
Please find Ratios spreadsheet attached with submission.
I was quite anxious going into step 8 as I was hoping I could complete the linking correctly and understand what the ratios were telling me. I am excited to learn more about my company through the financials.
Trying to calculate the share price was difficult to locate on my financial statements as there was a lot of figures. I ended up needing to control F and find the closing share price as putting “Share price” came up with a lot of results. I had to search this closing share price within each financial statement as they did not show in each other’s that I could locate. My understanding of the ‘Share Price’ is the dollar amount that investors want and are willing to pay for one share of the company’s stock and products. I was very interested in this ratio as I feel like so far Spectris do really well with their figures. Once I calculated the share price, I was happy to see the trend had become positive. In 2015, the amount that investors were wanting to invest which by 2018, it turned to 6 million – finish this
With the ordinary share price, I found this easy to locate on the financial spreadsheet. Once I calculated the share price, I was happy to see the trend had became positive. In 2015, the amount was 0.6 million which by 2018, it turned to 6 million.
Profitability Ratios
Profit margin = Profit after income tax (NPAT)/ sales. Within the profit margin ratio, my understanding is that it compares sales and demonstrates how well the company is actually doing and how much is returning into net profit. So, we would want to see it as a higher ratio, as the higher it is, the more profit is going into the company. What return are we gaining? After looking at Spectris Net Profit Margin ratio, I am very happy with the figures. From 2015, the net profit was 8.9% and began to get higher over the years. In 2018, the ratio was 13.7% which is a great improvement from 2015.
It is my understanding that Return on Assets (ROA) is an indicator of how efficient the company is at using its assets to actually generate the earnings. I can imagine that the higher the ratio, the better as this would mean the company was successfully handling the assets. Comparing Spectris ROA ratio, there is improvements from 2015 – 2018 by quite a lot. In 2015, the ratio was 7.3% which climbed to 10% in 2018. This means that in 2018, Spectris received 10% of the total assets back and earned $0.10 for every $1 it has in assets.
Efficiency Ratios
My understanding of the days of inventory is it is how long it is taking the company to sell the products. I found this section challenging and it was hard to determine what to select as the ‘daily cost of goods sold’. Looking at Spectris days of inventory, it was interesting that in 2015, the days totalled 131.41 and as the years went on, it improved drastically in 2017 with 97.61 to then spike again in2018 with 133.36 days. In my opinion, this is not a positive result as it is showing that from the time the product is produced, it stays in inventory for that period of time. However, if we assume Spectris maintains a constant quantity in its inventory, which is seems to by looking at the figures, there may be economic or competitive factors that are causing the high inventory days. I did a quick research and there are several high competitors with Spectris including Bruker, which has had funding go into the company with a total revenue of $3.9 billion, or Shimadzu with a revenue of $3.5 billion. This would definitely impact the sales that Spectris is producing, although still being quite competitive.
My understanding of total asset turnover ratio is it helps us to identify how efficient the company are using their assets and the sales created from the assets. Looking at Spectris total asset turnover ratio, it has not done very well as it is all averaging about 1-cent. I believe a good turnover ratio should be around 4 -6 from research and speaking with other students, as this usually means the rate which companies restock items is balanced.
Liquidity Ratios
Looking at the current ratio, it is my understanding that you are analysing and comparing the company’s current assets to its current liabilities and how well they pay for the current liabilities or short term obligations. For Spectris, the % has shifted from 2015 to 2018. In 2015, the current ratio is 2.96 and in 2018 it is 2.43. The current ratio for Spectris is telling us that they were able to pay their debts and short-term obligations. The higher the ratio, the more capable a company is to paying its obligations so although it did go down from 2015, I was quite happy to see Spectris Liquidity ratio was more than 1. These records indicate that Spectris is in good financial health. Although, because it didn’t really change from 2017 to 2018, this may mean that there was a weakness in the current ratio which includes the difficulty of comparing and measuring all the operating businesses or lack of trending information.
Financial Structure Ratios
My understanding of the Equity ratio is it is funded by shareholders and determines the portion of assets that are funded by debt or equity. Looking at Spectris 2018 figure, it was 58.9%, so for every dollar of assets that was funded by the equity investors, only roughly 58.9c was invested.
In relation to the Debt/ equity ratio, it is my understanding that this will show that for every dollar the equity investor is investing, how much is the bank or another contribution company actually is putting in to fund the business. In 2018, this was 69.8% which I believe is quite high, as this may show investors how much debt Spectris is in. It has increased from 2015. With only 51.0% and even 2017, which was only 49.4%.
Market Ratios
When I calculated the dividends per share it was quite large which made me question if I did it correctly. Listening to Maria’s video on Ratios, the dividends are meant to be low, as this is the amount paid out in dividends to shareholders and investors. Although as per the study guide chapter 4, dividends can be affected by a firm’s dividend policy, which then ultimately affects what is being transferred. After referring to the financial statement for 2018, Spectris proposed to pay a dividend of 40.5 pence ($0.78 Australian money), combined with the interim dividend of 20.5 pence ($0.39 Australian money), gives a total dividend of 61.0 pence ($1.17) per share. I am still not sure how the total dividends I have calculated within the ratios came to such a high number. It may be impacted from future investment needs.
The basic earnings per share is the difference between diluted (what if), earnings per share is what is based on profit. Comparing Spectris figures, I am pleased with the higher earnings however, was significantly reduced from 2015, $176.33 to 2018, $35.02. This is telling us Spectris’ profitability from its profit and shares. It is my understanding this is calculated to determine, for every share, how much have we earned. It is the total profit, spread across total number of shares and what they could have paid out to the company. This would need to be a larger figure as companies would rather retain earnings than provide to shares
My understanding of Price Earnings Ratio is the measurement of inflation of a shares and how long it will take to pay back with investment. I was a bit concerned when I saw Spectris figures at 0.07 for 2018 and even less in 2016 and 2015 at 0.01. My understanding is economic conditions can influence the Price Earnings ratio as they affect the financial market. Another reason why this figure may be so low, is the company may have increased its debt. This is a bit confusing as with the liquidity ratio, we can see Spectris is very successful with paying off the debt.
Ratios based on reformulated Financial Statements
The difference with this section of ratios is we have separated the operating and financial assets. I was really happy with the return on equity ratio as the trend is going in a positive direction from 2015 at 10.95% to 2018 of 17.04%. This tells me that Spectris are able to generate profits from its shareholders and investors of the company.
In relation to the Return on Net operating Assets I compared to RNOA under return on assets within Probability and trend is similar but when we separate the financing items, the return gets better and gives better identification on how Spectris is using their operational assets.
For the net borrowing costs, I can understand that we would be comparing this like an interest rate on loan. Spectris figures and percentages tell me good source of financing in the last two years as it is decreasing the cost of the loans from 2017 to 2018.
When I calculated the profit margin figure and compared it to the margin above I can understand that for every dollar of sales we are turning 13.1c (as per 2018) into operating income. I can see the trend is starting to increase and there not much difference with the profit margin in profitability ratios, in fact they are almost identical. The net profit margin is also telling me that most of the income is to do with operating activities.
My understanding of the total asset turnover is calculating how many times are we are turning over the dollar value of our assets into sales. I can imagine we would want to see a bigger figure and see that it is increasing. In relation to the Asset turnover, when I calculated the figure I compared to Total Asset Turnover in the Efficiency ratio. I noticed that the trends are similar but both slightly decreasing. This may mean that Spectris may not be utilising their assets to actually generate the sales. The turnover has improved when separating the finances out from the rations based on reformulated Financial Statements.
Economic profit
My understanding of Economic Profit is it calculates the total revenue received and also implies the costs for a firm. It is to measure the earnings of the firm. To work out the Economic profit, we can look at the main drivers which is Return on net operating assets (RNOA). RNOA is the Operating income after tax (OI) divided by the Net operating assets (NOA). For the weighted average cost of capital (WACC) I decided to use 11% as when I was searching the financial statements for Spectris from 2015 to 2018 it remained 11%. I was reluctant to use this percentage for WACC as the recommended figure from the assessment instructions was 10%. However, I decided to stick with what was on the financial statements as this also wouldn’t change much from 10% to 11% I imagine.
In 2018, the economic profit was $46.77, in 2017 it was $52.83, in 2016 it was $20.76 and in 2015 it was -$16.69. I was happy that most of the totals were positives. Spectris is trying to produce their goods to maximise the profit and the totals pf economic profit meant that the profit is a greater return than the WAAC. In 2015, as the profit did not go over the WACC which resulted in a negative economic profit. I was surprised considering how well Spectris did with its closing balance’s within the Statements of Movement in Equity, and the total of assets and liabilities. It had quite a large number of total operating assets and liabilities in 2015 through to 2018 including the NOA of $1584.20 in 2018. A firm’s normal profit is revenue, including explicit and hidden expenses, whereas the economic profit is the difference between the revenue received from the sale of an output and the cost of all the inputs used. From reading the study guide, it is my understanding that the economic profit is the ‘what if’ analysis for production levels. I believe the economic profit may have may resulted in a negative in 2015 from the hidden costs such as equipment, labour or production costs from the different operating business that weren’t taken into account. They may not have been taken into consideration in relation to the financial statement and accountants may not have included it.
Step 9
I actually really enjoyed completing this section of the assessment. I found it really interesting to put these figures in excel and work out the payback period for the two options.
Spectris is wanting to identify a group of potential operating businesses to expand the work capital and deliver greater value to a wider group of clients. To do this, they are considering investing in two operating businesses. The first option is Instrument Solutions and the second option of investment is Ergon Energy. Currently Spectris has several operating businesses that operate and supply award-winning productivity-enhancing instrumentation and control systems and products to a wide variety of customers globally. There is now an opportunity for Sprectris to expand its operating businesses and invest to gain further economic growth.
As there are several other businesses and investors that Instrument Solutions and Ergon Energy may have, it is suggested that each of these products be given the length of 10 years. Managers need to decide and make decisions that will affect the business long-term and it is a goal for making long-term capital investments These two choices of investment are expected to provide benefit in many years in the future. Spectris’s aim is sales growth and to become a more focussed and simplified business, which is highlighted several times in their financial statements. The cash flows generated by both of these businesses would ensure profit is going back into equipment and resources for the systems, technically demanding industrial applications and products that Spectris and its operating businesses use each year. It will also contribute to staff wages and marketing of Spectris. While choosing the right investment we have to consider, would this investment create us value for long-term decisions? As once you commit to these long-term investments, it is not easy to reverse or go back on the investment decision. There is the benefit of both options being an Independent project meaning the cash flow of one investment are unaffected by the acceptance of the other investment.
The investment will begin on January 1, 2021 and the estimated future cash flows are expected to be received on 31 December of each year. The estimated cost, the estimated years, residual value and estimate future cash flows of each investment opportunity are set out in the table below. All amounts are express in Australian Dollars AUD. We are going to assume the rate of return/ discount rate/ WACC of 11% as this is the same as I used with my ratio, which was the WACC I found for Spectris within the financial statement. We are going to estimate that Instrumentation control sell products for 2m and Ergon Energy sell products for 3m.
| Instrument Solutions | Ergon Energy | |
| Original Cost | $55 million | $70 million |
| Estimated years | 10 years | 10 years |
| Residual vision | $2 million | $3 million |
| Estimated future cash flows: | ||
| Year 1 – 31 December 2021 | -3 million | – 5 million |
| Year 2 – 31 December 2022 | $10 million | $12 million |
| Year 3 – 31 December 2023 | $15 million | $22 million |
| Year 4 – 31 December 2024 | $20 million | $11 million |
| Year 5 – 31 December 2025 | $25 million | $25 million |
| Year 6 – 31 December 2026 | $11 million | $17 million |
| Year 7 – 31 December 2027 | $16 million | $10 million |
| Year 8 – 31 December 2028 | $21 million | $18 million |
| Year 9 – 31 December 2029 | $7 million | $8 million |
| Year 10 – 31 December 2030 | $13 million | $14 million |
Please find below the Net Present value (NPV), internal rate of return (IRR), and the payback period for each option of investment. Again, the discount rate is 11% and the NPV has been calculated using this rate. The below figures are all displayed in Australian Currency (AUD).
| Instrument Solutions | Ergon Energy | |
| Net Present Value (NPV) | $20.11 | $3.18 |
| Internal Rate of Return (IRR) | 17.6% | 12% |
| Payback period | 4.52 years | 5.29 years |
The Net Present Value (NPV is essentially the difference between the present value of cash flows over a period of time. I have used this formula to analyse the profitability of my two investment options. While calculating the NPV of the each of my options of investment for Sprectris, I was really looking for a positive NPV as this will indicate that the investment would add value to the firm. Having a positive NPV would highlight that the firm will get more back than the cost of the capital. Both Instrumentation Solutions and Ergon energy both has positive NPV, although Instrument Solutions NPV is greater, this gives a more competitive edge.
With the Internal Rate of Return (IRR), we are measuring the investment rate of return. We are using this context savings and loans on the investment and we need it higher than the discounted rate of 11%. Again, the higher the rate the better as we need to ensure the return of the investment will outweigh the actual cost of the investment. If the IRR is negative, there would be no reason to consider the investment option as it would not give a good return. The IRR rate for Instrument Solution is 17.6% where as Ergon Energy was 12%. Although both of these investment options are is higher than discount rate, Instrument Solutions have exceeded the IRR a lot more than Ergon energy, which again, gives Instrumentation Solutions a leading edge.
The payback period refers to how many years it would take for the initial cost of the project/ investment to be earned back to Spectris from the cash flows that were estimated. We need to ensure that the payback period doesn’t exceed the initial estimated years for the investment. If it does, there would be no reason to take the investment. For option 1, Instrument Solutions occurs in approx 4.52 years. The payback period for Ergon Energy is 5.29 years. Again, if Spectris chose option 1, Instrument Solutions, they will receive the initial cost of the investment back earlier.
The main weaknesses I can see with these investment options is that the cash flows are estimations which would clearly really impact all the figures associated with the investments as it is not a true representation of the figures. I can imagine it would be difficult to really understand and know each cash flow. There are also several weaknesses with the NPV, IRR and the Pay back period. The payback period ignores the time value or money and it does not adjust or account for differences in the over all investment, which may impact the time in which the company received the initial cost of investment. This method also does not take into consideration the cash flows after pay back, therefor the company may not have a true representation to determine if the investment will be worth it or not. The weakness associated with NPV is it is very reliant and sensitive to the discount rate, which therefor would be easy to manipulate and change. Any changes in the discount rate would mean big changes to the NPV. In relation to the IRR, the weakness of this method would include potential unrealistic assumptions about the reinvestment of funds.
Based on the figures above, even with the weaknesses, Spectris should chose option 1 of Instrumentation Control as it had the best payback period, NPV and IRR compared to option 2 of Ergon Energy.
Based on the figures above, even with the weaknesses, Spectris should chose option 1 of Instrumentation Control as it had the best payback period, NPV and IRR compared to option 2 of Ergon Energy.

